2014issue C0753-56
Modified renko construction with RSI bands and a trend filter
Range bars and renko bricks are offered as lower-noise charts, but missing wicks, mismatched opens and closes, and untradable virtual bars limit automation. A modified brick with wicks and a true reversal open can host length-scaled RSI bands and an index trend filter once those construction limits are treated as known constraints.
- Interval line charts keep only successive endpoints and drop the rest of each interval's price path.
- Range bars and renko bricks can be automated only after missing wicks, mismatched displayed opens and closes, and untradable virtual bars are treated as known constraints.
- A modified-renko brick can add wicks and a true reversal open, then take fills from an hlc-overlay at the opening print or from the next open on the underlying chart.
- Length-scaled rsi-confidence-interval-band rules enter and exit at the next open, and a trend-filter was proposed as an overlay for declining markets.
What interval charts keep
Interval line charts keep only successive endpoints and drop the rest of each interval's price path. Range bars and renko-brick charts are offered as lower-noise types, yet they still depend on how each box is built.
Limits that block automation
Historical automation of those charts is limited by missing wicks, displayed opens and closes that may not match actual prints, and untradable virtual-bar units inserted to fill gaps. Those chart types can be automated only after those construction limits are treated as known constraints.
Modified bricks from tradable prices
A modified-renko construction can add high and low wicks and place the true open on reversal bricks. The same logic can be built from end-of-day prints, where reconstructed shapes tracked the candle path more closely than the reported timestamps.
Two ways to take a fill
One test design uses an hlc-overlay of high-low-close prices on the bricks so market fills still occur at the opening print. Another construction treats bricks as virtual: the signal is taken from the brick, and the fill is shown at the open of the next bar on the underlying chart.
Brick size, volume, and streaks
Brick-size can be defined in ticks with separate up and down counts plus a multiplier, allowing asymmetric-noise-absorption of rising versus falling jitter. Size and absorption can also be left to an optimizer. Volume can be mapped from the underlying chart onto the matching bricks, and a streak-counter can report how many consecutive up or down bricks have printed.
RSI bands and a trend filter
An adjustable-band RSI rule enters long at the next open when RSI is below a length-scaled lower rsi-confidence-interval-band and exits at the next open when RSI is above the matching upper band. Shorts reverse the same pair of tests, and a switch can restrict the test to long-only, short-only, or both.
A long-only historical protocol on the NASDAQ 100 used next-open entries and exits and a close-based stop. An index trend-filter was proposed to address drawdowns in declining markets.
RSI-band long trades versus the S&P 500 on the NASDAQ 100
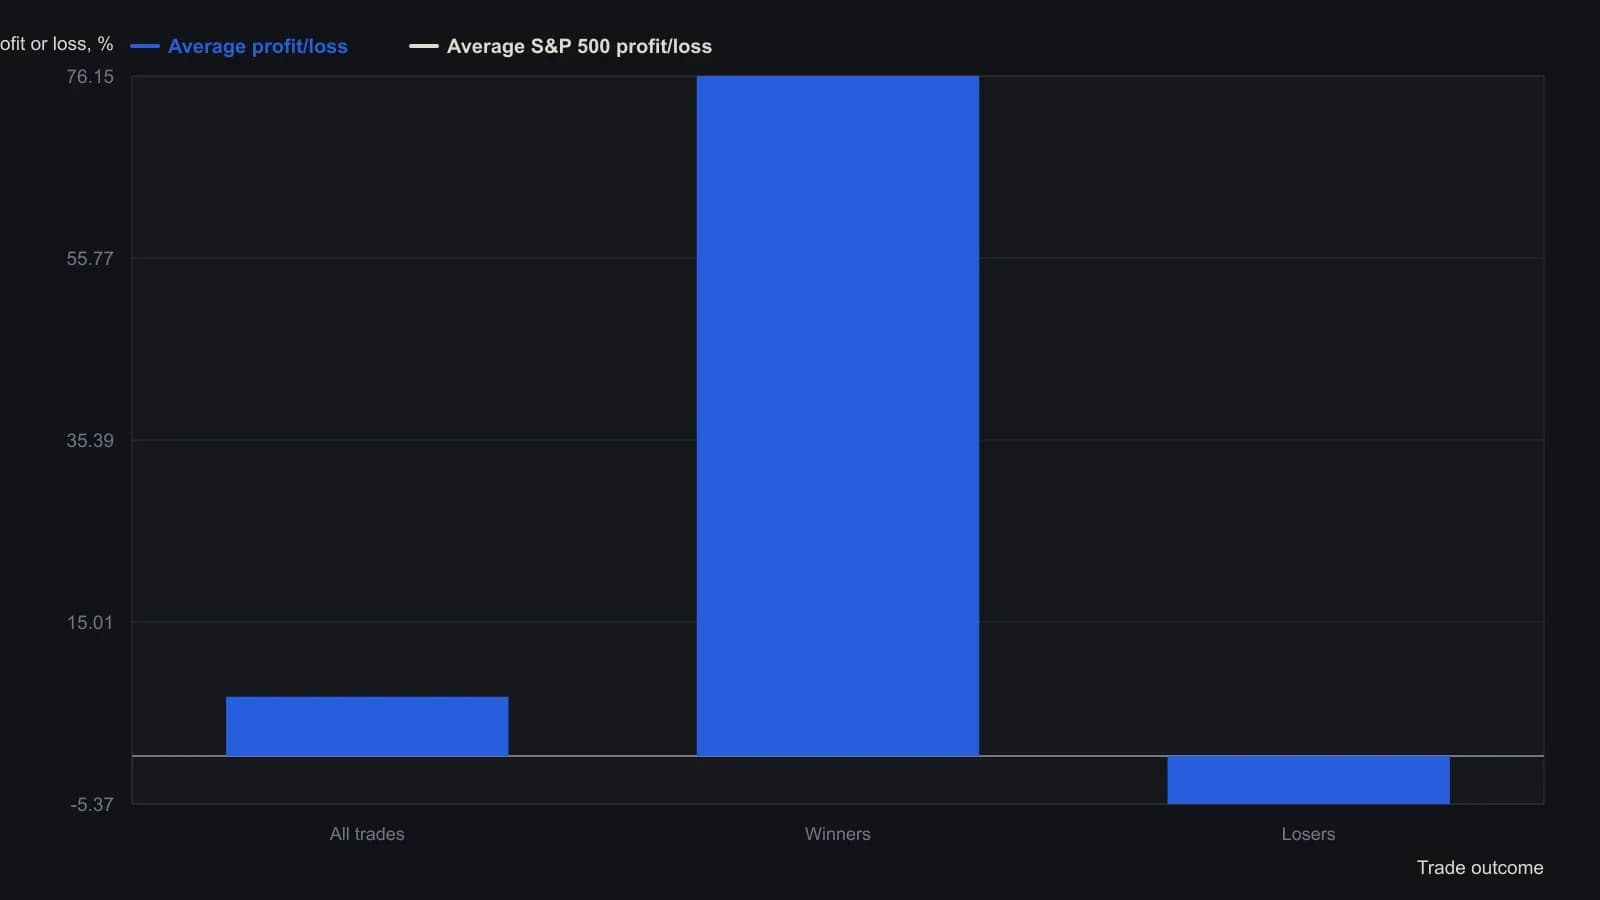
Long-only; neither commission nor slippage subtracted. Capital protection 98 percent (a 2 percent close-based stop). Entries and exits at the next open. The short side of the same rules lost money even with index trend filters.
All readings on this track · 14 readings
- 2007Renko brick construction and breakout rules
- 2014Modified Renko brick size from tick inputs
- 2014Renko brick increment and open construction
- 2014Modified renko construction with RSI bands and a trend filter
- 2014Construction checklist for a brick-chart crossover and same-session breakout
- 2015Optimizing virtual bar size as a trend filter
- 2015Constructing Renko energy bands so support and resistance arrive as pre-marked leans
- 2018Five-rule entries and exits with Elliott waves and Renko bricks
- 2018Modified Renko charts as a filter for fake breakouts
- 2018V-Trade reversal, retrace, and continuation rules
- 2018A finished impulse, a Fibonacci target, and a reversing Renko brick as one test
- 2019Brick sampling changes what a volatility envelope can show
- 2019A consecutive Renko brick count as a mechanical entry-exit procedure
- 2019Renko brick scale as a falsifiable trend hypothesis