2019issue C0148-56
Brick sampling changes what a volatility envelope can show
A brick-aware volatility envelope was specified so band width can still expand and contract when the chart is built from equal-size bricks. Classic deviation bands and that brick-aware reading locate sideways channels, support, and resistance in different ways.
- A brick-aware volatility envelope was specified so band width can still expand and contract when the chart is built from equal-size bricks instead of equal-time bars.
- On a brick chart, a conventional volatility envelope can fail to make those width changes visible, which is the stated reason a separate envelope was introduced.
- A side-by-side comparison treats the brick-aware envelope as a tracker of price and brick structure, and treats classic deviation bands as the more volatility-sensitive locator of sideways, well-defined channels.
- A separately smoothed typical-price midline lets the envelope and the moving-average support and resistance line use different lookbacks.
Sampling by brick size instead of clock time
A brick series of a given calendar window usually contains fewer bricks than a time-bar series of the same window, because quiet or sideways stretches can be absorbed into a single brick.
A brick-aware volatility envelope was specified so that band width can still expand and contract when the chart is built from equal-size bricks instead of equal-time bars. On a Renko chart, bricks replace equal-time bars, so the same sampling change applies.
On a brick chart, a conventional volatility envelope can fail to make those width changes visible, which is the stated reason a separate envelope construction was introduced.
How the published envelope is built
One published construction sets the upper envelope from a weighted average plus that average scaled by an average true range term, and the lower envelope from the same average minus a reduced-range term.
The same construction also plots a separately smoothed typical-price midline, so the envelope and the moving-average support and resistance line are not forced to share one lookback.
The brick-aware envelope was demonstrated on a mean-brick S&P 500 chart and on an average-true-range range chart of a currency pair, showing that the study was meant to travel across both brick and range sampling.
Different questions about channels
A side-by-side comparison treats the brick-aware envelope as a tracker of both price and brick structure, and treats classic deviation bands as the more volatility-sensitive locator of sideways, well-defined channels.
Editorial note: in that comparison, Bollinger Bands are the classic deviation-band reading. They are used to locate a sideways, well-defined channel. The brick-aware envelope is used to follow price together with the brick structure that remains after quiet stretches have been absorbed.
Support and resistance on a separate average
A complementary moving-average reading treats repeated tests of an average as support or resistance in a continuing trend, and treats a break through one or more averages as a candidate reversal condition.
Because the midline is smoothed separately from the envelope, that support and resistance reading can use a different lookback from the band width. Editorial note: the archive presents this as a complementary reading, not as a replacement for the envelope.
SVE volatility bands versus 2.4-sigma Bollinger bands on 2018 daily prices
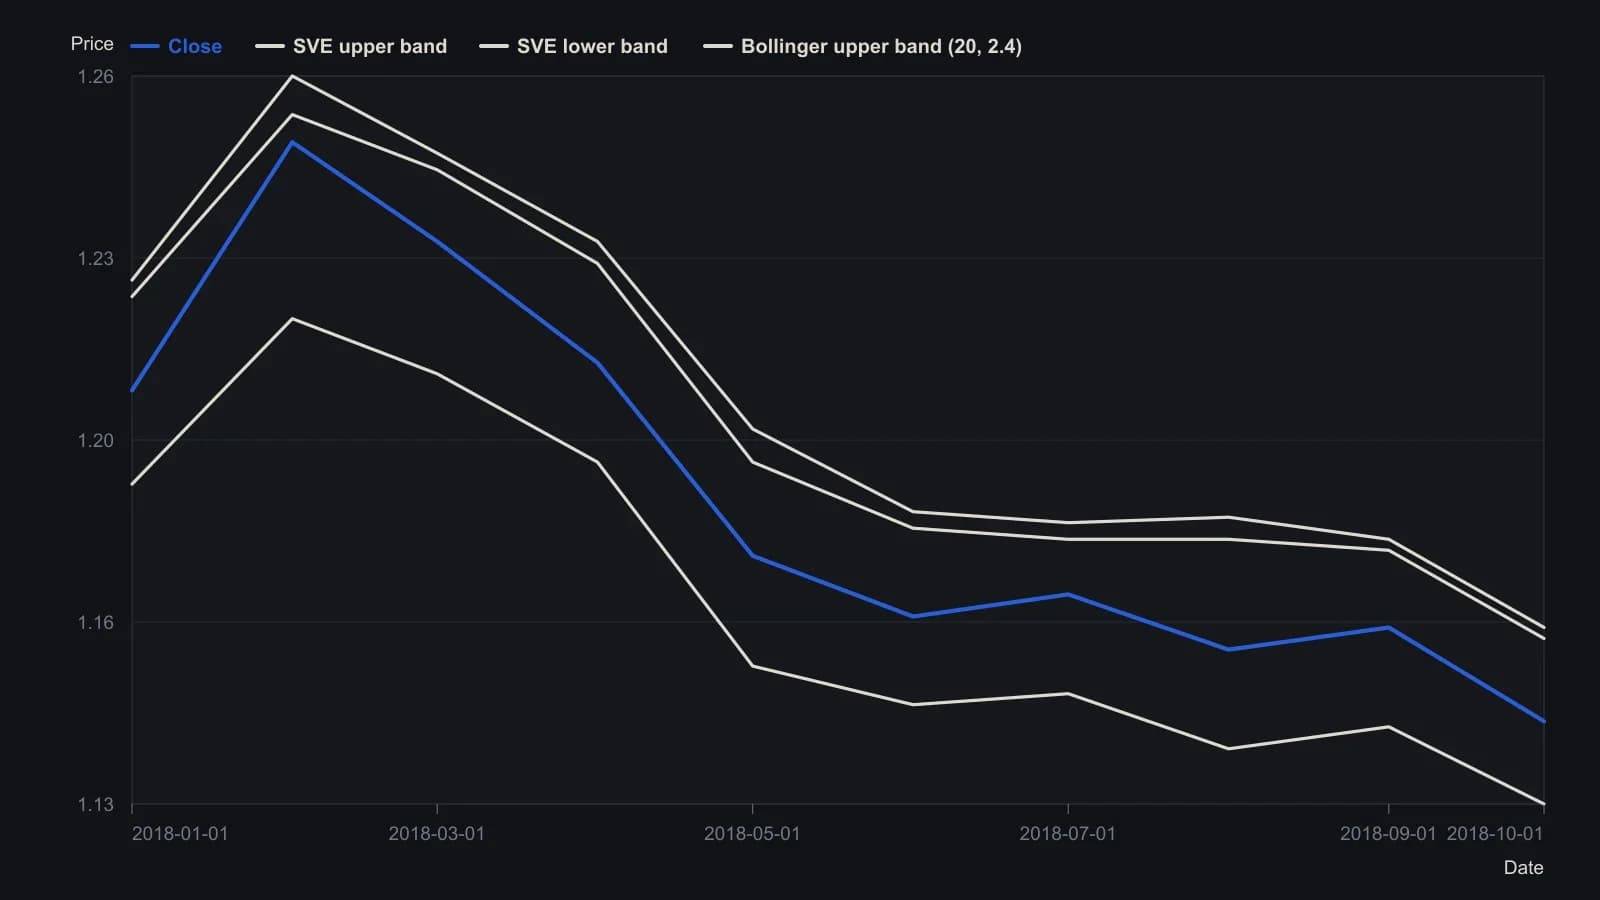
The NeuroShell formulas in the source fix SVE at period 20, deviation 2.4 and low-band adjust 0.9, and Bollinger bands at 20 bars with 2.4 standard deviations. The pane is clock-time daily bars, not renko bricks.
All readings on this track · 14 readings
- 2007Renko brick construction and breakout rules
- 2014Modified Renko brick size from tick inputs
- 2014Renko brick increment and open construction
- 2014Modified renko construction with RSI bands and a trend filter
- 2014Construction checklist for a brick-chart crossover and same-session breakout
- 2015Optimizing virtual bar size as a trend filter
- 2015Constructing Renko energy bands so support and resistance arrive as pre-marked leans
- 2018Five-rule entries and exits with Elliott waves and Renko bricks
- 2018Modified Renko charts as a filter for fake breakouts
- 2018V-Trade reversal, retrace, and continuation rules
- 2018A finished impulse, a Fibonacci target, and a reversing Renko brick as one test
- 2019Brick sampling changes what a volatility envelope can show
- 2019A consecutive Renko brick count as a mechanical entry-exit procedure
- 2019Renko brick scale as a falsifiable trend hypothesis