2018issue C0126-29
Evaluating a normalized risk index for drawdown and exposure limits
Two declining sequences can share a standard deviation of 0.82 percent and still produce cumulative losses near 9 percent versus about 20 percent. Editorial view: evaluate a risk number by whether it can refuse or shrink a position while the account is still intact, using median peak-to-close shortfall scaled by expected range as the drawdown limit, the exposure cap, and the ruin budget.
- Two declining return sequences can share a standard deviation of 0.82 percent and still produce cumulative losses near 9 percent versus about 20 percent, so volatility alone does not size a drawdown limit.
- Variance scores gains as well as losses, tracks dispersion around an average rather than a peak, squares extremes, and understates tail loss when returns are skewed and leptokurtic.
- The normalized risk index is median peak-to-close shortfall divided by expected range; readings above 0.5 have used more than half the budget and readings above 1.0 have exceeded it.
- In a fully invested versus cash exposure-cap test, cutoffs near 0.5 or lower kept equity time under 50 percent and cutoffs near 2.0 or higher approached full investment, so the same cutoff spends more or less of the risk-of-ruin budget.
Risk as the chance of losing capital
Market participants typically treat risk as the chance of losing capital, while common practice still equates risk with two-sided return volatility.
Two declining return sequences can share a standard deviation of 0.82 percent and still produce cumulative losses near 9 percent versus about 20 percent, so volatility alone does not size a drawdown limit.
Why variance is a weak drawdown limit
Variance is a weak drawdown limit because it scores gains as well as losses, assumes a near-Gaussian shape, tracks dispersion around an average rather than a peak, squares extremes, and does not hold still across assets or periods.
Standard deviation gives trustworthy probabilities only near a Gaussian shape, yet about 2,499 daily returns on a broad equity proxy were about 4.7 standard errors skewed and about 15 standard errors leptokurtic, so tail loss is understated.
Peak-to-close shortfall
A lower partial moment retains only shortfalls versus a target and uses exponent a so that a equals 1 is mean shortfall, a equals 2 overweights large misses, and a equals 2 with the target at the mean is semi-deviation.
For an ulcer-style retracement, the target is the log distance from the lookback maximum close to the latest close, actual return is the latest log change, and only positive target-minus-return values enter the shortfall series.
Because the shortfall series is bounded at zero and heavily skewed, the median is used as the robust center. On one 10-year daily sample the median shortfall was 1.60 percent while the mean was 4.25 percent and nearer the 75th percentile at 5.15 percent.
Scaling shortfall by expected range
Expected maximum excursion is a random-walk estimate of typical range equal to step size times the square root of the number of steps. Expected range is estimated as median absolute return times the square root of lookback length, and a 64-day median of unsigned daily returns is the step size so extremes are not squared. Median absolute return is the median of unsigned close-to-close percentage changes.
The normalized risk index is median shortfall divided by that expected range. It is a unitless retracement-versus-range score. Readings above 0.5 mean retracement has used more than half the budget and readings above 1.0 mean it has exceeded the budget.
One cutoff for exposure and ruin
A drawdown limit is a bound on peak-to-close capital damage that is checked before entry and while a position remains open. An exposure cap sets how much of the account may stay in the risky asset once a downside reading crosses a chosen cutoff. Risk of ruin is the chance that a run of losses exhausts the account; here it is managed by tightening or loosening the same cutoff rather than by changing the formula.
In a fully invested versus cash exposure-cap test, cutoffs near 0.5 or lower kept equity time under 50 percent and cutoffs near 2.0 or higher approached full investment, so raising the cutoff spends more of the risk-of-ruin budget and lowering it spends less.
Normalized risk index on SPY, 2008–2017
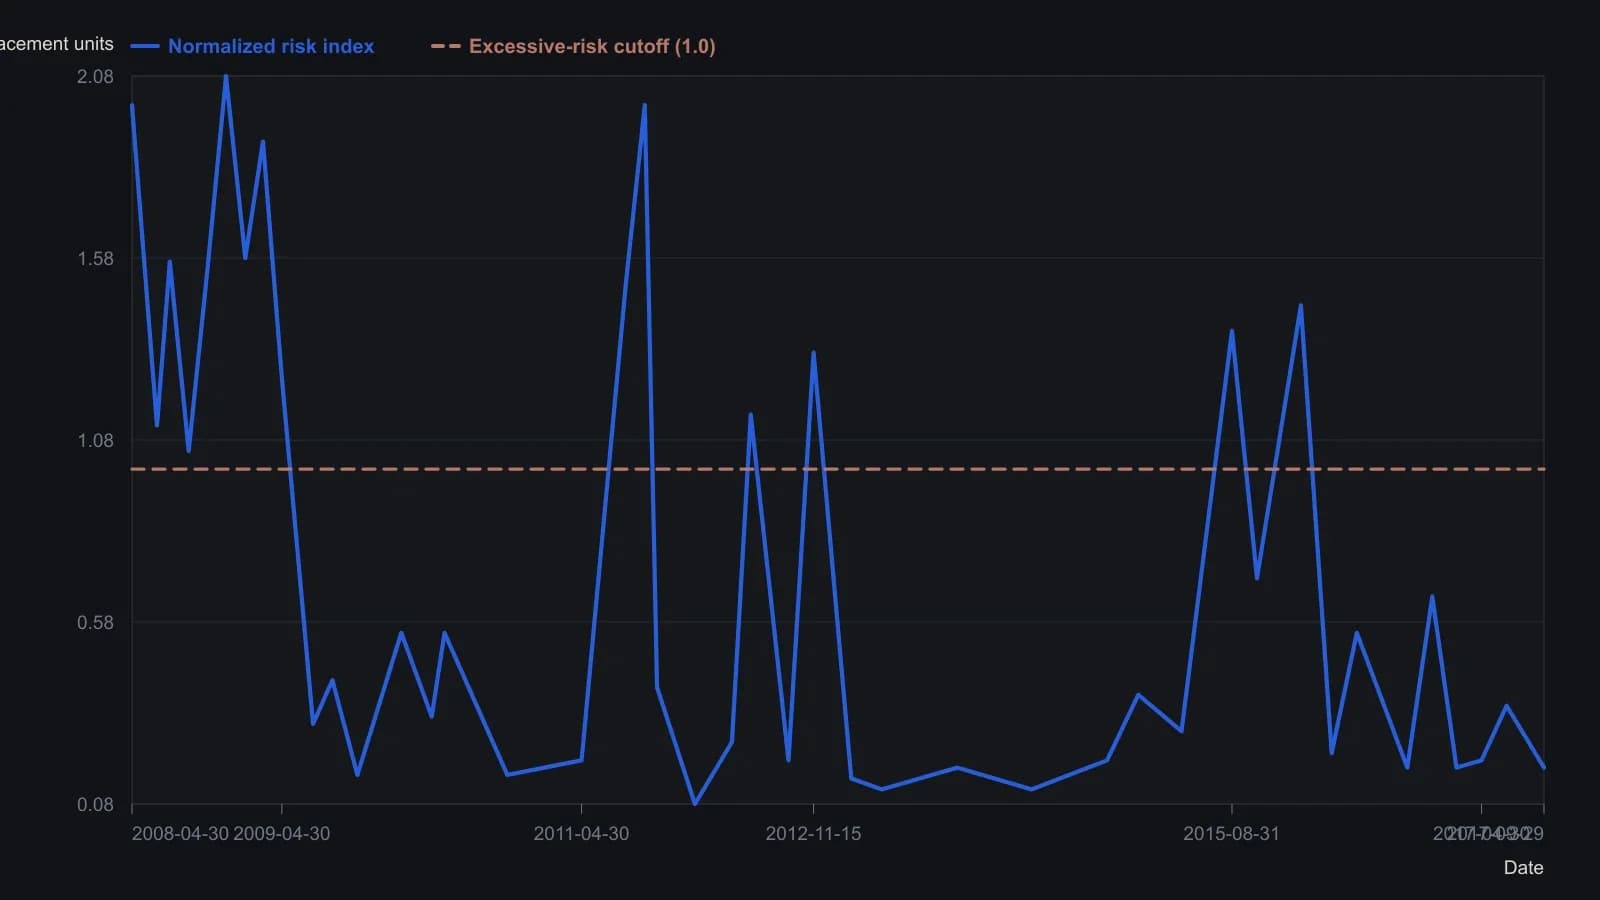
Source fixes the lookback at n = 64 trading days and ends the sample on 29 September 2017. The published price series is omitted because it does not share the index unit. Expect a few hundredths of error on the index.
All readings on this track · 6 readings
- 1988Name the stop, then decide if the account can pay
- 1988Limited-risk labels versus exposure and ruin
- 1992Risk of ruin and exposure caps as a pre-trade filter
- 1994When standing puts fail the drawdown test
- 2017The minimum-margin habit is not commodity-market risk
- 2018Evaluating a normalized risk index for drawdown and exposure limits