1995issue C081-5
A normalized dispersion screen for trend-following
Some systematic procedures skip a directional forecast and ask only whether a market historically persists long enough for a trend-following rule to be relevant. The n-day trending index normalizes n-period change dispersion by one-period change dispersion and ranks the ratio inside a random-walk Monte Carlo.
- A trend-following procedure can skip a directional forecast and ask only whether historical persistence makes the rule relevant.
- Eye inspection of two price paths does not reliably detect persistence, so the workflow uses a volatility-normalized n-day trending index against the square-root-of-n baseline.
- A random-walk hypothesis test treats that index as elevated only when it exceeds a stated significance-percentile of Monte Carlo draws.
- A full-sample index does not evaluate intermittent trend-following that uses an abstention-filter such as momentum, volume, or open interest.
A relevance question, not a directional forecast
Some systematic procedures skip a directional forecast and ask only whether a market historically persists long enough for a trend-following rule to be relevant. Trend-following is a signal procedure that turns rule inputs, market state, and execution constraints into entry, exit, or abstention over the system holding period. The screen below asks whether persistence is present before that procedure is treated as relevant.
Why two charts are not a test
Inspecting two price paths by eye does not reliably separate an uncorrelated series from one whose next signed move repeats the last sign with elevated probability. Persistence is positive dependence between successive signed moves that widens the distribution of n-period net changes. A formal comparison is needed to tell those cases apart.
The square-root-of-n baseline
Under independent unit steps, average net displacement after n trials is the origin and the standard deviation of the ending position equals the square root of n. Persistence widens the ending-position distribution so its standard deviation exceeds that independent square-root-of-n baseline. Because market increments vary in size, the comparison uses the ratio of n-period change dispersion to one-period change dispersion. Under independence that ratio equals the square root of n. That independent-step expectation is the square-root-of-n baseline: a volatility-normalized n-period displacement ratio equal to the square root of n.
The n-day trending index
The n-day trending index is the standard deviation of n-session price changes divided by the standard deviation of one-session price changes. That ratio was computed at four-, nine-, sixteen-, and twenty-five-session horizons on ten listed futures over a 1,012-session window. For Treasury bonds, four-session change dispersion of 1.138 over daily dispersion of 0.588 produced a four-day index of 1.935. The same arithmetic was applied to every market and horizon in the sample.
A Monte Carlo significance-percentile
A random-walk hypothesis test checks whether normalized n-period price-change dispersion matches the independent-increment baseline that the ratio equals the square root of the horizon. Monte Carlo simulation is repeated construction of random ordered price series so an observed n-day trending index can be ranked inside a chance distribution. An index was treated as statistically elevated only when it exceeded 85 percent of 10,000 Monte Carlo trending-index draws from 1,000-day random series. That significance-percentile produced cutoffs of 2.04, 3.06, 4.09, and 5.11 at the four-, nine-, sixteen-, and twenty-five-session horizons.
What the historical window showed
Coffee cleared those cutoffs at every horizon. Crude oil and live cattle showed a milder elevation. Most of the remaining series did not exceed the random-walk screen over the full four-year window.
What a full-sample index cannot say
A full-sample index does not evaluate intermittent trend-following that uses momentum, volume, or open-interest filters to stand aside during non-persistent intervals. Those auxiliary conditions are an abstention-filter: they keep a trend-following rule out of the market during non-persistent intervals. The historical workflow therefore answers a relevance question for the whole window, not a claim about filtered, intermittent use of the same rule.
n-day trending index by futures market, 1991–1995
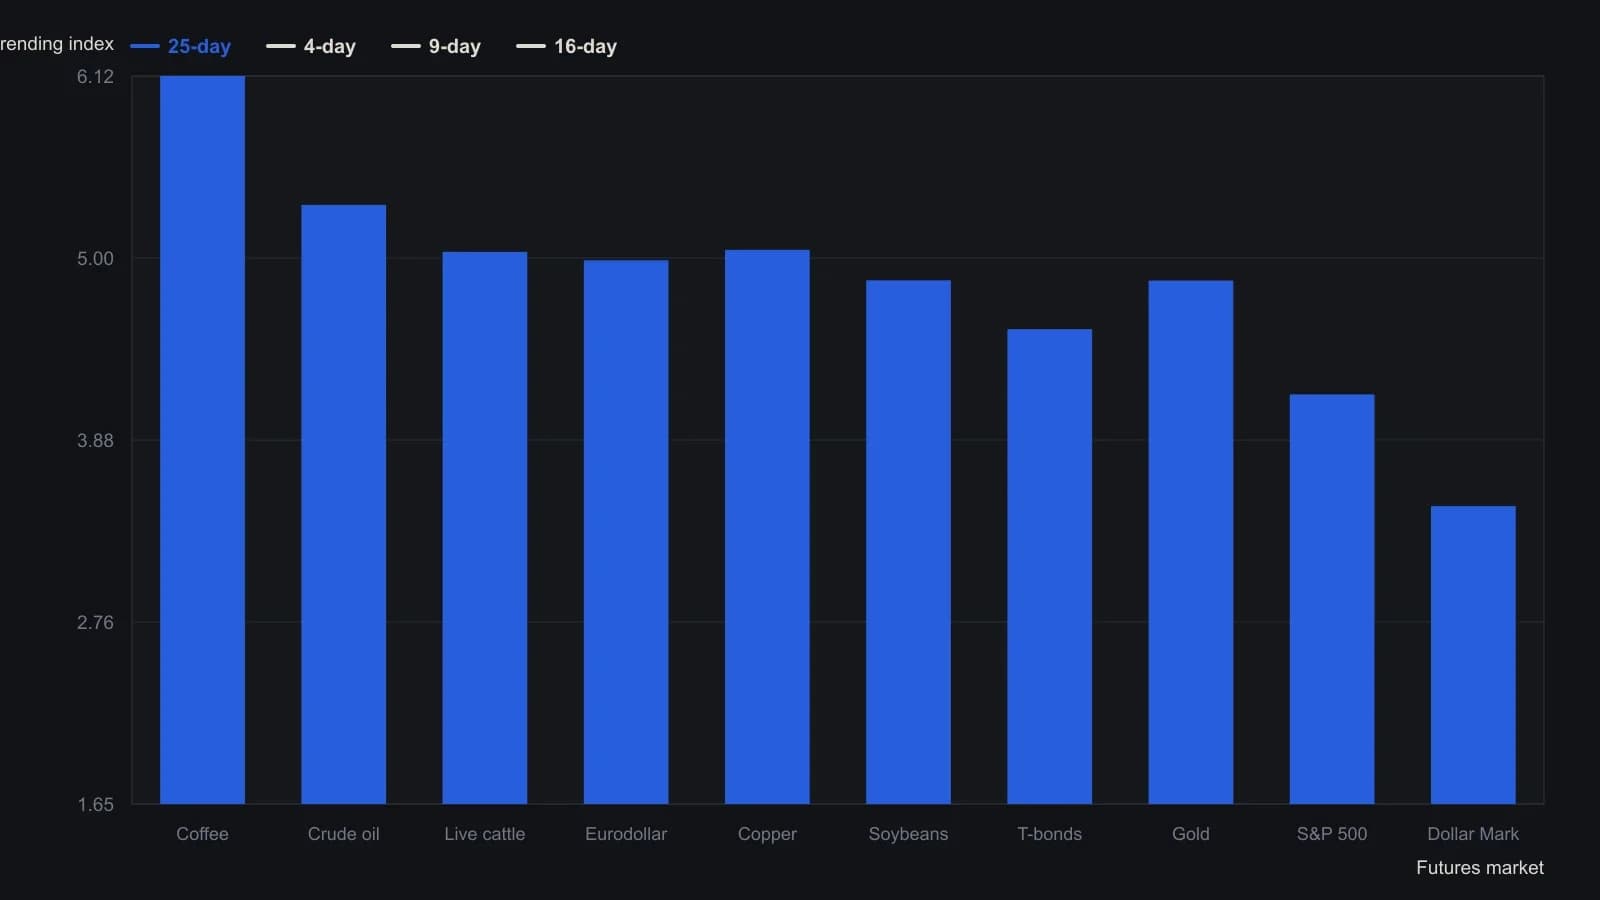
An index is called significant only if it exceeds 85 percent of 10,000 random 1,000-day paths. Those cutoffs are 2.04 (4-day), 3.06 (9-day), 4.09 (16-day) and 5.11 (25-day). Windows overlap. The full-sample index does not speak to filtered, intermittent trend systems.
All readings on this track · 10 readings
- 1984When random walks fail to explain market averages
- 1988Building probability-density adaptive weights and a chi-square trend filter
- 1990Withhold a random-walk label until grouping and lookback are checked
- 1991Constructing a variable-lookback random walk trend filter
- 1992Ranking futures trend tendency against a random walk
- 1995A normalized dispersion screen for trend-following
- 1997Why failed random-walk tests still need careful Monte Carlo work
- 2007Constructing a random-walk baseline from ordered returns
- 2011Constructing a cycle-free trend filter against an ATR-scaled random walk
- 2013How to evaluate a hybrid growth and money-flow scan