2013issue C1218-29
How to evaluate a hybrid growth and money-flow scan
Four dated scans scored two-month forward absolute and market-relative returns for a growth screen, a money-flow screen, and a hybrid of both. The design used a Random walk hypothesis test as the null, then a Chi-square test and Monte Carlo simulation to ask whether the hybrid added information.
- Reconstruct each historical scan from a dated watchlist and score returns only after the scan date so the evaluation window stays out of sample.
- Apply the same four-date, two-month-forward protocol to the growth screen, the money-flow screen, and the hybrid so differences can be attributed to the rules.
- Score relative returns against the S&P equal-weighted index rather than the capitalization-weighted S&P 500 so a few large names do not dominate the baseline.
- Use a Random walk hypothesis test as the explicit null, Chi-square test counts of outperform versus underperform, and Monte Carlo simulation to check whether hybrid differences survive a change in path.
A growth screen, a money-flow timing screen, and a hybrid of both can be compared only if each scan date is treated as a sealed test window. The archive workflow collected four dated market scans, one in 2010, one in 2011, and two in 2012, then measured each selected stock’s subsequent absolute and market-relative return at regular intervals through the next two months.
Keep every scan date out of sample
Because the scanner could not backtest in place, historical scans were reconstructed from dated watchlists on machines frozen at earlier dates. The lists were then exported and scored only after the scan date so the evaluation window stayed out of sample.
That reconstruction is what makes the later statistical tests interpretable. If names are scored with information that arrived after the scan, a Random walk hypothesis test, a Chi-square test, and Monte Carlo simulation are no longer tests of the published rules.
Compare three rule sets on one protocol
The growth screen required 90-day dollar volume above 387,000, year-over-year quarterly earnings growth above 14.5%, trailing-four-quarter earnings growth above 11%, year-over-year quarterly revenue growth above 14.7%, trailing-four-quarter revenue growth above 12.3%, return on equity above 12%, long-term debt no more than twice common equity, a four-quarter net profit margin above 11.2%, and a price-to-sales ratio no higher than 5.
The technical screen reused the same liquidity floor and required MoneyStream near a three-month high, Time Segmented Volume near the top of its 40-day range, and price no higher than 96% of the 52-week high.
The same four-date, two-month-forward protocol was used to compare the fundamental screen, the technical screen, and a hybrid that applied both sets of conditions. Differences could then be attributed to the rule set rather than to a change in sampling interval or lookback.
Choose a market baseline that a few large names cannot dominate
Relative performance was scored against the S&P equal-weighted index rather than the capitalization-weighted S&P 500 so that a few large names would not dominate the market baseline. Editorial reading: that choice keeps the two-month comparison aligned with a broad list of selected names rather than with the largest capitalizations in the cap-weighted index.
Test whether the hybrid adds information
The statistical evaluation treated a random-walk null as the explicit baseline. If successive returns are unpredictable, dated screens should not systematically beat the equal-weighted market over the fixed two-month horizon. That is the Random walk hypothesis test against which the three rule sets are judged.
Chi-square test counts of outperform versus underperform outcomes across scan dates and market regimes were the planned test of whether observed win frequencies departed from the random-walk expectation.
Monte Carlo simulation, implemented as resampling of the same ordered price, volume, and breadth series, was specified as a robustness check on whether hybrid-versus-single-method differences survived a change in path rather than a single historical sequence.
Editorial reading: use the three methods in that order. First ask whether dated screens beat the equal-weighted market under the Random walk hypothesis test. Then use the Chi-square test on outperform versus underperform counts. Finally use Monte Carlo simulation to check whether hybrid-versus-single-method differences persist when the path of the ordered series changes. The archive describes that workflow. It does not establish that any screen is profitable.
AEGR share price around the 12 October 2012 scan
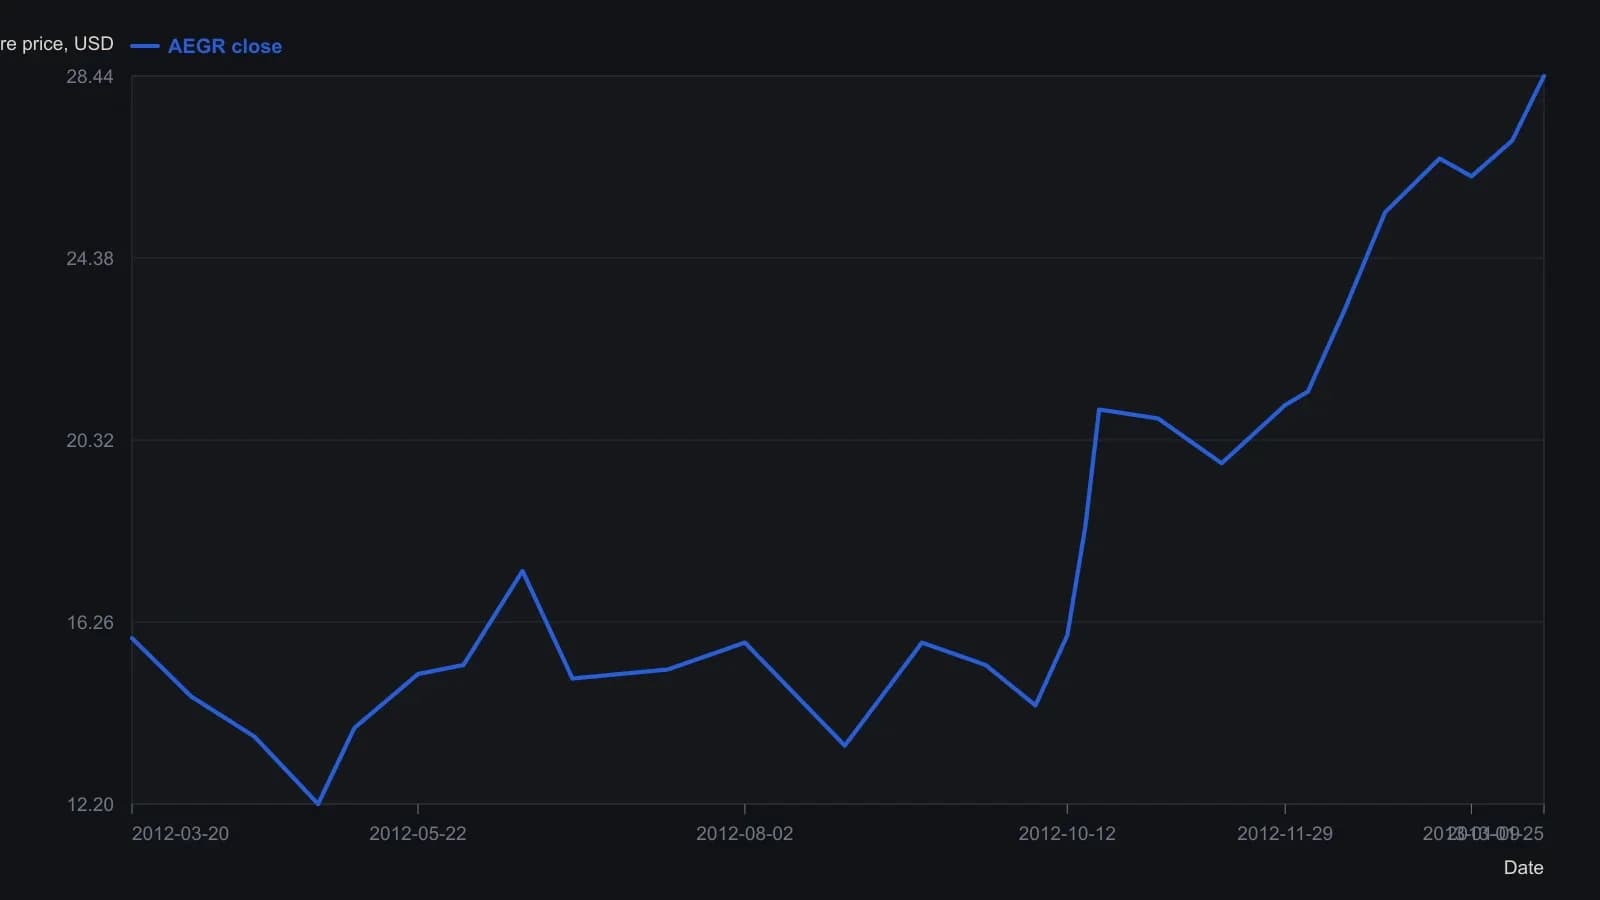
The 15.96 scan-day close and 28.44 last price come from the platform header. Other closes are read from the labeled dollar grid on a logarithmic daily scale and are approximate to about 0.3 dollars.
All readings on this track · 10 readings
- 1984When random walks fail to explain market averages
- 1988Building probability-density adaptive weights and a chi-square trend filter
- 1990Withhold a random-walk label until grouping and lookback are checked
- 1991Constructing a variable-lookback random walk trend filter
- 1992Ranking futures trend tendency against a random walk
- 1995A normalized dispersion screen for trend-following
- 1997Why failed random-walk tests still need careful Monte Carlo work
- 2007Constructing a random-walk baseline from ordered returns
- 2011Constructing a cycle-free trend filter against an ATR-scaled random walk
- 2013How to evaluate a hybrid growth and money-flow scan