1988issue C021-9
Building probability-density adaptive weights and a chi-square trend filter
This article reconstructs a three-layer historical workflow: convert price, non-seasonal volume, and new participation into density-based probabilities, adaptively reweight those factors after later outcomes, and only then apply a user-chosen chi-square randomness screen.
- The directional layer scores price, non-seasonal volume, and new participation from a probability density function fitted around a moving average, not from untransformed prices or high-low ratios.
- Adaptive weighting raises a factor when its earlier mix lined up with later direction and lowers it when that pairing fails, so a conventional price-volume reading can invert if the historical association is negative.
- The companion chi-square randomness screen reports the probability that a full-cycle window is random, with low values read as trending and high values as random, and with no built-in significance cutoff.
- Editorial reading: keep the probable direction indicator and the trend-versus-random scale as separate layers so a directional reading is never treated as a trend by default.
A three-layer construction
The historical workflow first builds a probable direction indicator, then keeps a companion chi-square randomness screen beside it. Editorial framing treats that order as a three-layer stack: transform raw market series into density-based probabilities, let those factors reweight themselves after each later outcome, and only then apply a user-chosen randomness screen.
A directional reading is not treated as a trend by default. The first two layers answer how the density-weighted mix leans. The third layer answers whether the chosen window looks random.
Convert series into density probabilities
The directional construction converts raw series into probabilities from a probability density function fitted around a moving average. It does not score strength from untransformed prices or high-low ratios.
The density is treated as an assumption about how prices sit around that moving center. A symmetric bell shape and a skewed lognormal shape are both named as candidate forms. Each observation can then be scored from impossible to certain.
The same probability transform is applied to price, non-seasonal volume, and the share of new participants. Non-seasonal volume is volume after subtracting the open-interest change, so regular contract-cycle open-interest drift is removed and atypical day-trader activity is isolated.
Under a normal transform, typical observations cluster near probability 0.5. A tail event can map near 1 and therefore receive more leverage in a probability average than the same move would receive as a raw price increment.
Let the factors reweight themselves
After a later directional outcome is observed, adaptive weighting raises the influence of the three factors when the prior probability mix aligned with that outcome and reduces it otherwise. The mix can invert a conventional price-volume reading if the historical pairing is negative.
The finished probable direction indicator is then rescaled from the unit interval to 0-100. A high reading is described as a high probability of a subsequent decline.
Apply a chi-square randomness screen
The companion trend filter is a chi-square randomness screen over a user-set full-cycle window. The output is the probability that the window is random. On the trend-versus-random scale, low values are read as trending and high values as random. There is no preset significance cutoff.
The chi-square step is the squared gap between observed and expected frequency, divided by expected frequency. Choosing a 5 percent significance level on that 0-100 scale would classify more windows as random than a looser cutoff.
The randomness test is framed as a short-horizon check of the random-walk idea. The full-cycle window must cover whole cycles in days or weeks. A half-cycle or fractional multiple can bias the sample toward the repeated half.
PDI oscillator with CSI Trend randomness screen
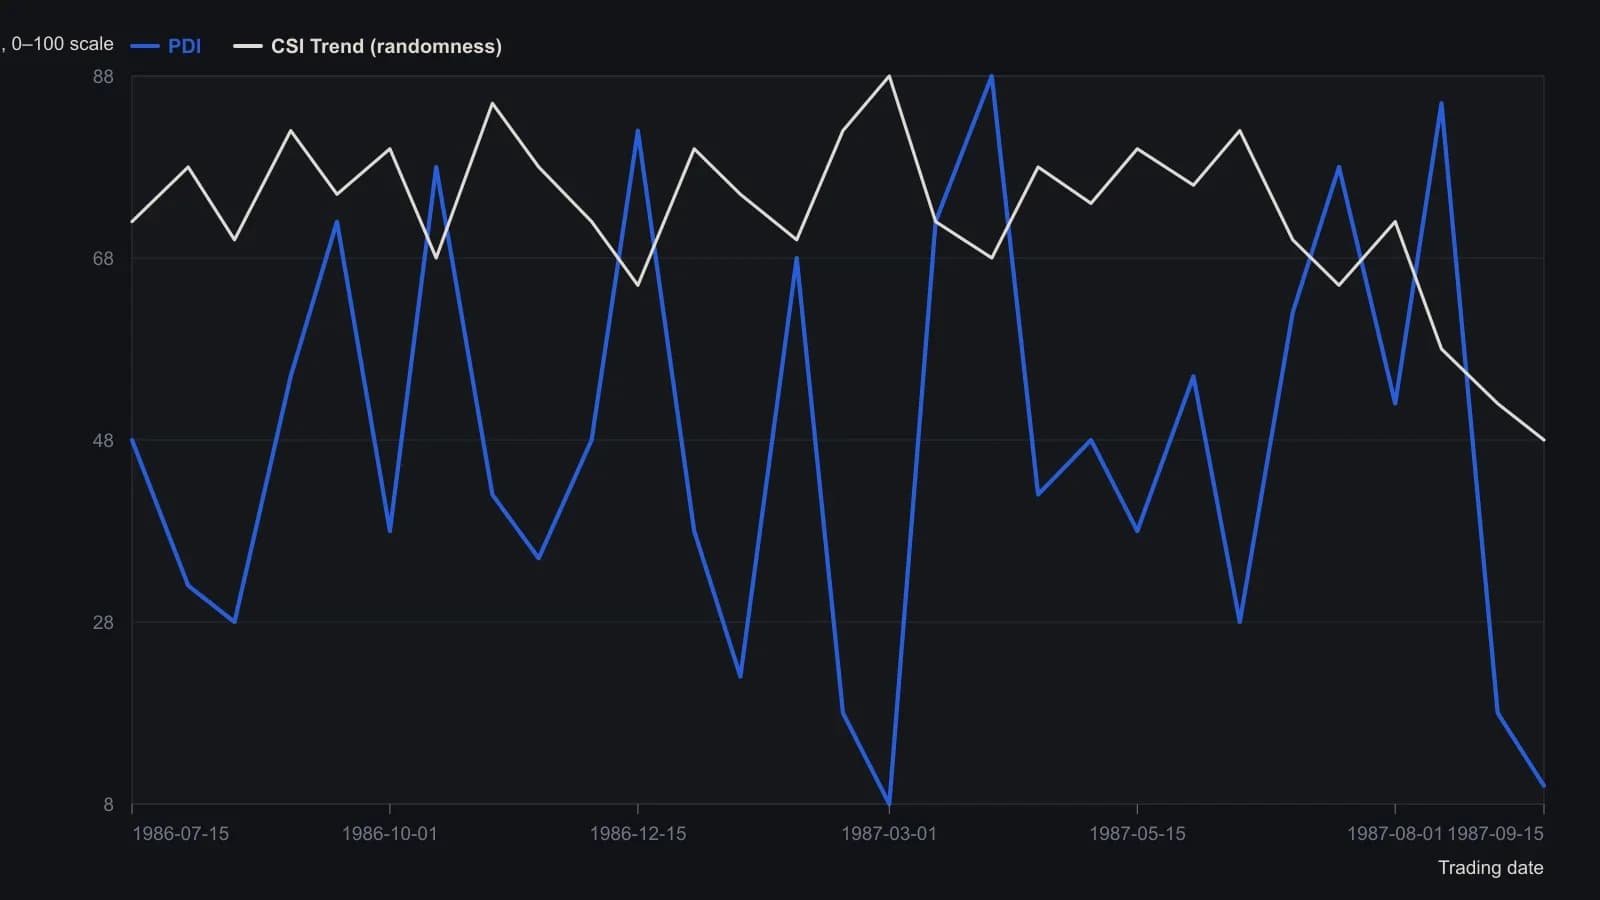
Raster is inverted and low-resolution; y-values are approximate to about 2–3 PDI points. CSI Trend is shown only as a qualitative companion because its numeric scale is not labeled on the plot.
Keep direction and trend as separate layers
Editorial reading: form the probable direction indicator first, then apply the chi-square randomness screen as a later gate rather than as a built-in label on the directional index. The density and adaptive-weighting layers describe how price, non-seasonal volume, and new participation have been mixing. The screen describes whether the chosen full-cycle window looks random.
Keeping those answers apart is the point of the stack. A high or low directional reading is not accepted as a trend unless the user also judges the trend-versus-random scale.
All readings on this track · 10 readings
- 1984When random walks fail to explain market averages
- 1988Building probability-density adaptive weights and a chi-square trend filter
- 1990Withhold a random-walk label until grouping and lookback are checked
- 1991Constructing a variable-lookback random walk trend filter
- 1992Ranking futures trend tendency against a random walk
- 1995A normalized dispersion screen for trend-following
- 1997Why failed random-walk tests still need careful Monte Carlo work
- 2007Constructing a random-walk baseline from ordered returns
- 2011Constructing a cycle-free trend filter against an ATR-scaled random walk
- 2013How to evaluate a hybrid growth and money-flow scan