2003issue C121-2
Constructing a hammer from a failed breakdown
A hammer is specified as a downtrend candle with a short real-body at the top of the session range and a long lower-shadow. A 10-minute chart rebuilds that daily candle as an open, a deep selloff, a rally back through the open, and a close near the session high.
- A hammer is a downtrend candle whose small real-body sits at the top of the session range, with a long lower-shadow at least twice that real-body, little or no upper-shadow, and no color requirement.
- Intraday-reconstruction on a 10-minute chart rebuilds the daily hammer as an open at 8320, a decline to 8220, a rally to 8340, and a close at 8331 near the session high.
- Before the hammer session, 8280 and 8237 are treated as nearby support that had already been slightly broken or tested.
- Because candlestick patterns can fail, a confirmation-session that continues the upward direction from the latter half of the hammer day is used as a check.
How a hammer is specified
A hammer is specified as a downtrend candle whose small real-body sits at the top of the session range, with a long lower-shadow and little or no upper-shadow. The long lower-shadow is required to be at least twice the length of the short real-body, and the color of that real-body is not treated as a requirement.
The real-body is the interval between the session open and close. The lower-shadow is the part of the session range that prints below the real-body. The upper-shadow is the part of the session range that prints above the real-body.
Rebuilding the daily candle
The hammer shape is the visual result of a session that sells off first and then rallies, marking a shift from seller control to buyer recovery within that session. Intraday-reconstruction means reading a shorter-interval chart of the same session to see the selloff-then-rally path that built the daily candle.
A 10-minute chart of the same session is used to reconstruct the daily hammer as an open, a deep selloff, a rally back through the open, and a close near the session high. In the reconstructed session, price opened at 8320, declined to 8220, rallied to 8340, and closed at 8331.
Nearby support as context
Before the hammer session, 8280 and 8237 are treated as nearby support that had already been slightly broken or tested. Support is a prior price area where a breakdown previously failed to hold, so a later recovery after trading through those levels is part of the pattern's context.
A confirmation-session as a check
Because candlestick patterns can fail, a following session that continues the upward direction from the latter half of the hammer day is used as a confirmation check. That confirmation-session is a following day that continues the late-session recovery direction of the hammer.
Dow Jones futures daily closes into the year-end hammer
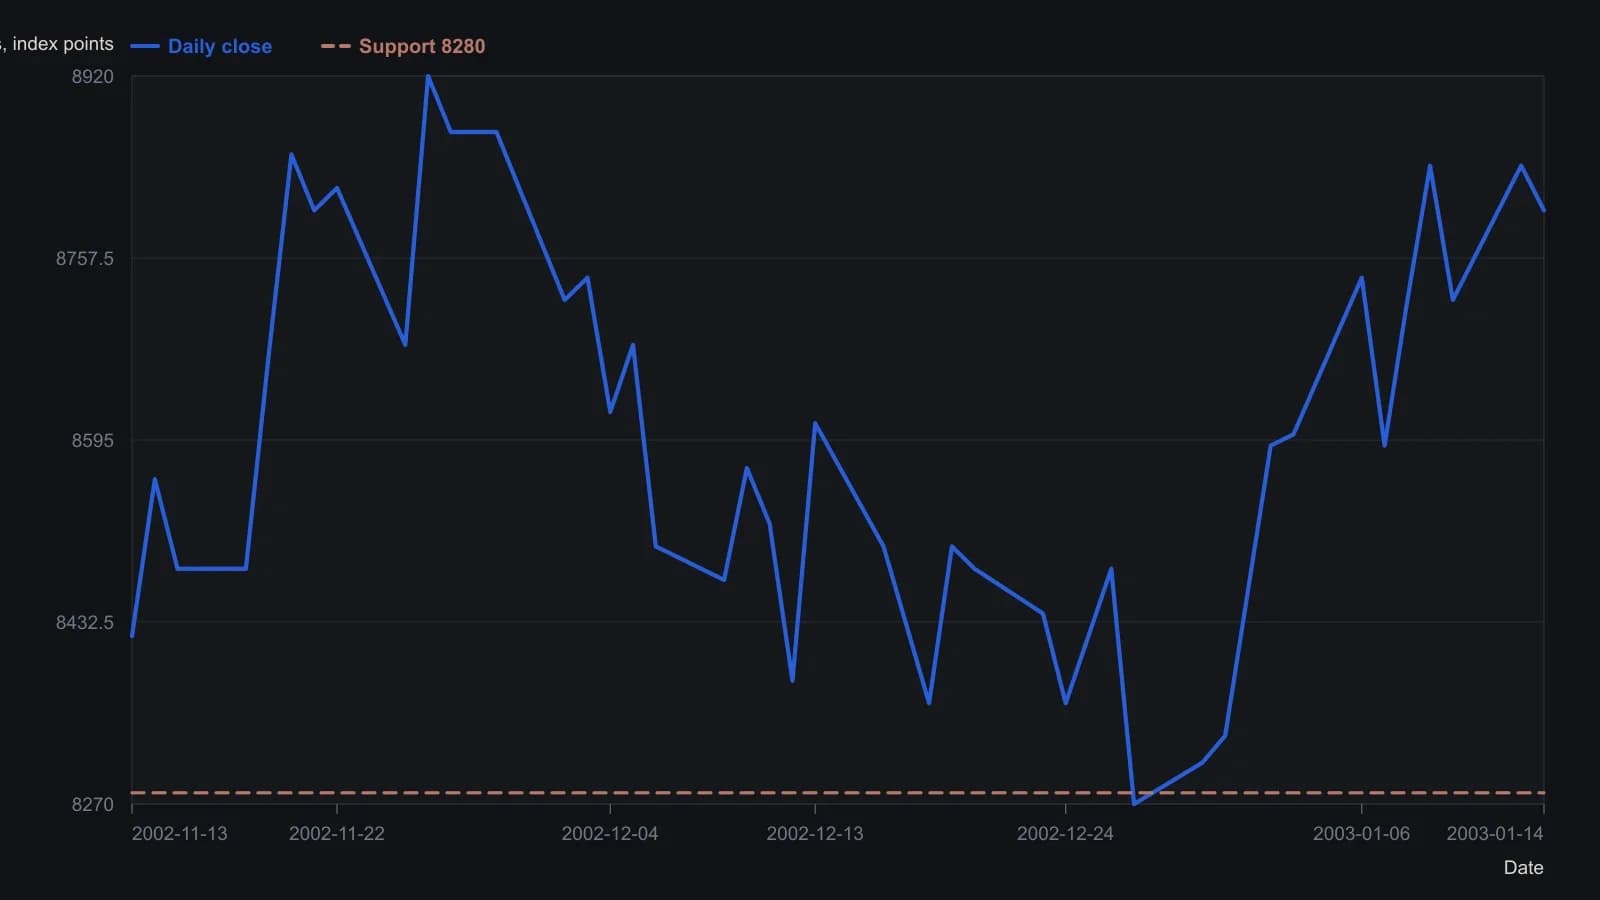
Figure 1 has no printed close table. Daily closes are read from the candle bodies to the nearest 10 index points except where Clive Lambert states exact prints: 27 December close 8270, 30 December close 8307 after a 8237 low, and the 31 December hammer (open 8320, low 8220, high 8340, close 8331). The 8280 line is the key support he names as only slightly breached on 27 December.
All readings on this track · 8 readings
- 1992Constructing candlestick reversals from body, shadow, and trend location
- 2002A staged reading from long-shadow hammer to engulfing
- 2003Constructing a hammer from a failed breakdown
- 2004Hammer and hanging-man bars still need context and confirmation
- 2004Strength-rated hammer candlestick construction
- 2004Treat every paper umbrella as a timed experiment
- 2008Weekly engulfing, hammer, and soldier reversals as a control test
- 2018RSI, hammer, and moving-average gates for range hypotheses