2004issue C081-4
Constructing trendline calls with doji and engulfing
When price meets a rising, falling, or horizontal trendline, the open questions are break, failed pierce, hold, or a later role switch. Certify the line first with points, length, slope, tests, volume, and the close, then treat a same-timeframe doji or engulfing-pattern only as a filter for stall, hold, or a possible flip.
- A trendline is built from at least two nonconsecutive points, with three treated as the firmer validity standard, on any chartable series.
- Closing-price-confirmation decides a break. An intraday pierce that fails into the close is a false-break, and a higher-than-average volume break is treated as more trustworthy.
- A doji warns of a possible stall, not a completed signal. Filter it by location at a significant trendline or an extreme oscillator zone, then wait for a confirmatory-candle.
- An engulfing-pattern is a same-timeframe clue to reversal or continuation near the line. Candle formations are not used to set price objectives.
Four questions at the trendline
When price approaches a rising, falling, or horizontal trendline, the open construction questions are whether the line will break, whether a pierce will fail, whether the line will hold as support or resistance, and whether a broken line will later switch role.
A trendline is a straight line joining successive nonconsecutive swing points to mark an advance, a decline, or a range. A flat version functions as support or resistance.
How the trendline is constructed
A trendline is constructed by connecting at least two nonconsecutive points. Three nonconsecutive points are treated as the firmer validity standard. The same construction applies on any chartable series from multi-year down to five-minute bars.
A break is treated as more significant when the line is longer, flatter, and more frequently tested. A two-year line is ranked above a two-month line, which is ranked above a two-day line.
Cisco Systems daily close versus rising support, May 2003–April 2004
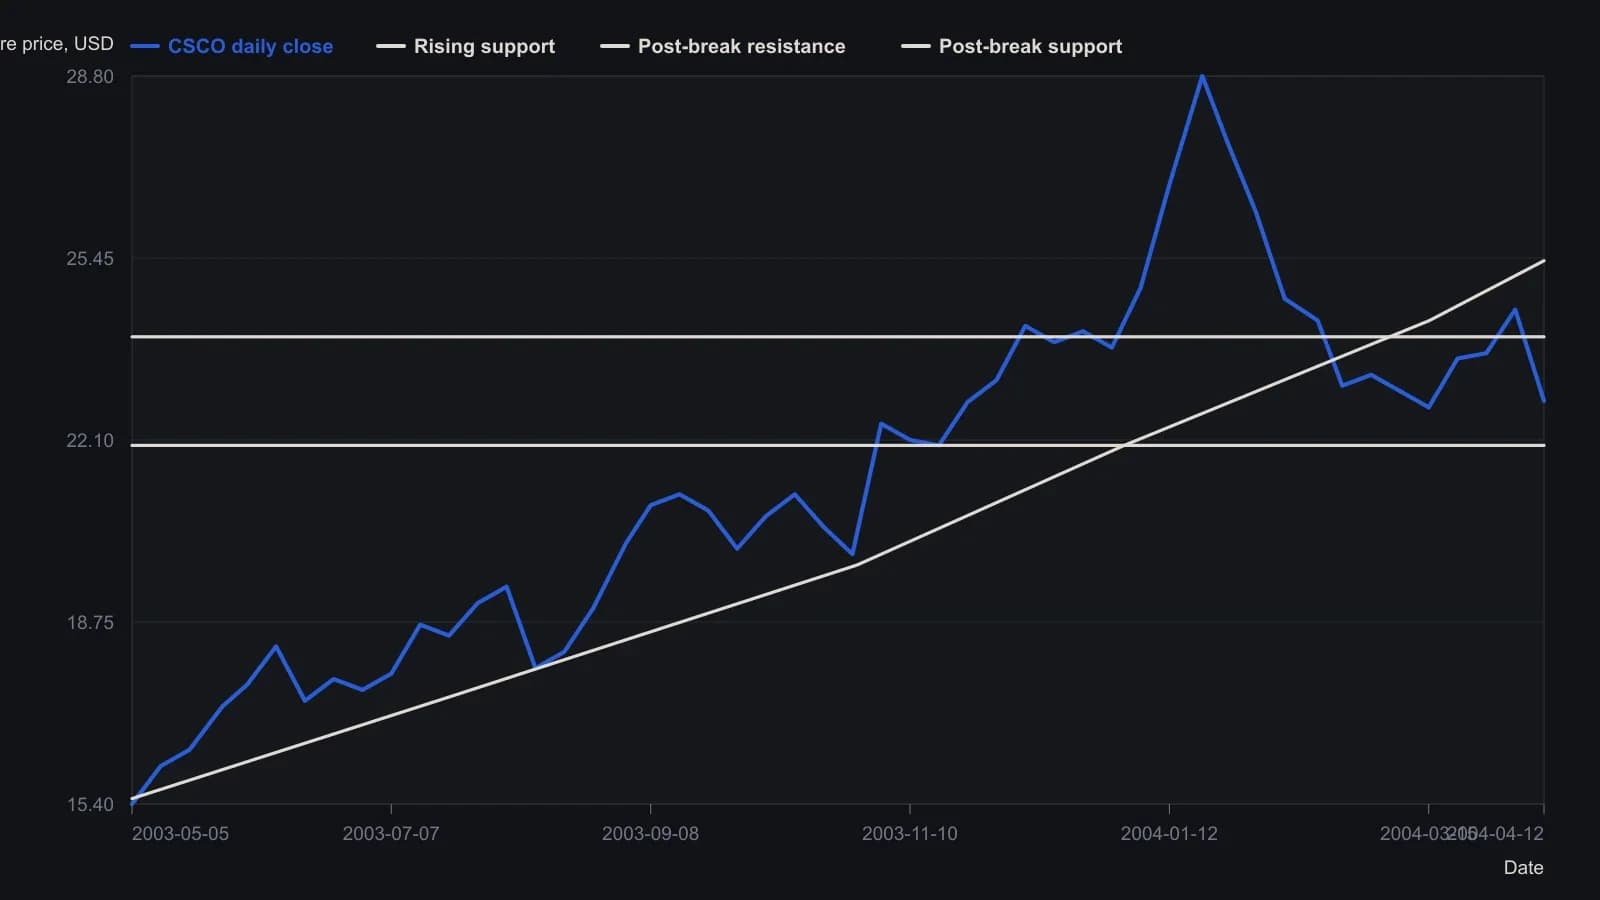
Closes are digitized from the raster, not from a price table, so they are approximate to about 0.2 dollars except the figure’s own last print of 22.82. Each point is a weekly sample of the daily series at the labeled session dates. The rising reference follows the author’s drawn support at the visible touch points; the 22 and 24 rails sit on the printed grid after the break.
Close, volume, and false-break
A trendline is judged broken only by the closing price, because an intraday move through a well-watched line can reverse before the close. That failed pierce is a false-break and leaves the original line still valid. Closing-price-confirmation is the rule that the session close, not an intraday extreme, must sit beyond the line.
A break on higher-than-average volume is treated as more trustworthy than a low-volume break.
Doji as a stall warning
A doji is a candle whose open and close sit at nearly the same price, showing buyers and sellers evenly matched. It is constructed when those two prices are approximately the same. It is classified as a warning that a stall or psychology change may be near, not as a complete trade signal, and it needs a later confirmatory-candle.
A stall is a pause in an existing trend that can precede a sideways stretch or a full change of direction. A confirmatory-candle is a later session whose close agrees with the direction implied after the warning.
Doji candles appear both at important turns and at other times, so they are filtered by location at a significant trendline or at an extreme zone on a western oscillator.
Engulfing-pattern construction
An engulfing-pattern is a two-session reversal construction in which the second real body opens beyond the prior extreme and closes through the opposite side of the first body.
A bearish engulfing is constructed in an uptrend after a small white body when the next session opens at a new high and closes below the prior open. A bullish engulfing is constructed in a downtrend after a small black body when the next session opens at a new low and closes above the prior close.
Candle formations are presented as same-timeframe clues to reversal versus continuation near a trendline. They are not used to set price objectives. Those objectives are left to other technical tools.
Other reversal constructions nearby
Other reversal constructions listed alongside doji and engulfing include the hammer, hanging man, shooting star, dark-cloud cover, morning star, and evening star. Each is defined by body location, wick length, prior trend, and in some cases gaps around a middle session.
All readings on this track · 11 readings
- 1992Constructing signed engulfing and doji detectors
- 1997Candlestick breadth timing on the 1996 S&P 100
- 2002Reading doji and engulfing after extended trends
- 2002A three-lock checklist for doji, gap, and stochastic reversals
- 2002Candlestick reliability after one-day follow-through
- 2004Constructing trendline calls with doji and engulfing
- 2004Doji construction, shadow geometry, and confirmation
- 2011Candlestick signals are not automatic trades
- 2011Breakout side versus catalog labels on finished candle recipes
- 2011Grading candlestick signals by frequency, trend, and breakout
- 2015Constructing candlesticks, doji, and hammer from OHLC