2004issue C071-3
Hammer and hanging-man bars still need context and confirmation
A hammer and a hanging man share one candle shape. The archive names the bar from the prior trend, then looks to the next session and, in a transport case, to a fifty-day exponential moving average as a nearby retest.
- A hammer and a hanging man share the same single-bar construction: a small real body near the top of the range, a long lower shadow, and little or no upper shadow.
- Candlestick context decides the name: the bar is a hammer only after a decline and a hanging man only after an advance.
- Session confirmation is the next open and close; a hammer is followed through by a higher open and higher close, and a missed follow-through is treated as selling pressure that had not receded.
- In the transportation-average case, downside follow-through after an early hanging man reached a fifty-day exponential moving average, and a second hanging man later formed on a bounce from that same average.
A hammer and a hanging man are described as sharing the same single-bar construction: a small real body near the top of the range, a long lower shadow, and little or no upper shadow. The same bar is treated as a hammer only when it appears after a decline and as a hanging man only when it appears after an advance. That prior trend is the candlestick context that decides whether the identical bar carries one name or the other.
Candlesticks are presented as a display of the same open-high-low-close data as ordinary bar charts. They are used to make buyer or seller control easier to see rather than as a separate information source.
How the session is read
The hammer session is described as an open, a sharp selloff, and a recovery that closes near the high. That sequence is read as a reduction in the pressure to keep selling. The long lower shadow records a selloff that was later retraced, and the small real body near the high is part of both look-alike bars.
The hanging-man session is described as an open near the high, a selloff, and a close back near the high. A lower open the next session is described as leaving buyers of that bar with a loss.
Session confirmation
Follow-through after a hammer is described as a higher open and higher close on the next session. Missing that follow-through is treated as evidence that selling pressure had not receded as far as the bar suggested.
Session confirmation is the next open and close, used to test whether the probability shift implied by the reversal bar actually continued.
Two historical cases
In the retail-index case, a mid-December hammer formed after a drop of more than 8 percent in two weeks and was followed by an advance from those lows over the next two and a half months.
In the transportation-average case, an early-April hanging man was followed by a higher close the next day, then by downside follow-through that brought price to a fifty-day exponential moving average three days later. That average is a smoothed average of recent closes, used here as the nearby level where a hanging-man warning was later retested.
A second hanging man on April 23 formed on a bounce from that same fifty-day exponential moving average. The next session printed a higher intraday high before the advance failed through the rest of April and into May.
Daily Dow Jones Transportation Average through the spring 2004 hanging-man sequence
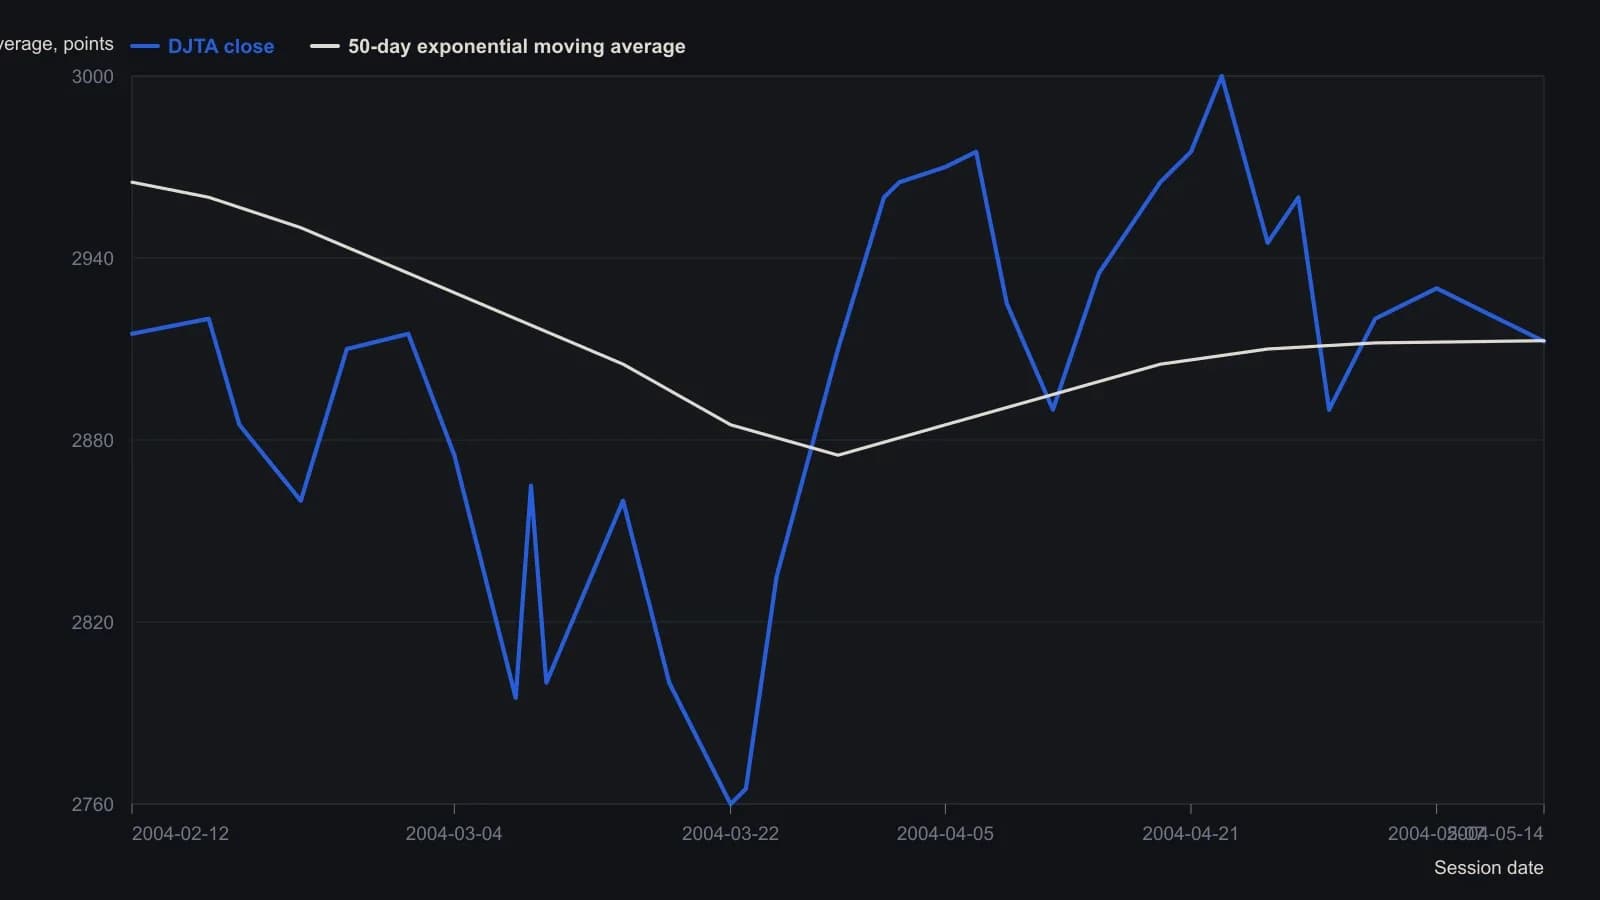
Intermediate closes were read against the printed 20-point grid and are only good to about five index points. The source treats a later open and close below the hanging-man low as confirmation and fixes the overlay at a 50-day exponential moving average.
All readings on this track · 8 readings
- 1992Constructing candlestick reversals from body, shadow, and trend location
- 2002A staged reading from long-shadow hammer to engulfing
- 2003Constructing a hammer from a failed breakdown
- 2004Hammer and hanging-man bars still need context and confirmation
- 2004Strength-rated hammer candlestick construction
- 2004Treat every paper umbrella as a timed experiment
- 2008Weekly engulfing, hammer, and soldier reversals as a control test
- 2018RSI, hammer, and moving-average gates for range hypotheses