2014issue C0814-18
Reading the 2008-14 DJIA as a Composite Operator campaign
A three-phase instructional campaign is restated on the 2008-14 DJIA. Cause is measured on a figure chart at the last point of support, and later ranges are read as confirming stepping-stones or as a support-and-resistance crown.
- Study a long advance as if one Composite Operator accumulates a line, marks it up, and later distributes it into late demand.
- After a sign of strength, take a conservative figure-chart count from the last point of support and treat the projection as a checkpoint, not an exact turning price.
- A mid-trend range can confirm the original count as reaccumulation, or it can become a crowning formation that holds support only while laggard demand is absorbed.
- The 2008-09 DJIA base and the 2011 range were read together because the later stepping-stone count overlapped the original upside projection.
A campaign in three phases
A 1931 instructional campaign is described in three phases. First a line of stock is accumulated while prices are low. Next the line is marked up. Then the line is distributed into late demand before a decline.
Market swings are to be studied as if one Composite Operator prepares, executes, and concludes those campaigns. The figure is offered as a useful fiction for reading motives from the chart.
The 2008-14 bull market is used as a language-matched reenactment of that campaign. Preparation is said to last several weeks or months while a line is accumulated in a weak, dull tape.
Accumulation after the panic
Accumulation is located after the October 2008 panic. Buying is said to have stemmed the decline near DJIA 8000. A later range near 8000-9000 is the place where stock is offered on rallies and bought on balance on weakness.
A March 2009 drive to about DJIA 6500 is treated as a terminal shakeout of stops under prior range lows. The nearly vertical recovery is a sign of strength. The pullback near 8100 is a last point of support before markup.
Cause measured at the last point of support
After a sign of strength, a figure-chart count is taken from the last point of support right to left, conservative phase first. The 2008-09 base is counted as 11100 DJIA points, with upside projections of 17600-19200.
Figure-chart counts are checkpoints for stopping to observe, not exact turning prices. A later sideways range can become a stepping-stone confirming count of the original count.
DJIA 3-box figure chart, 2008–2013, with count objectives from the last point of support
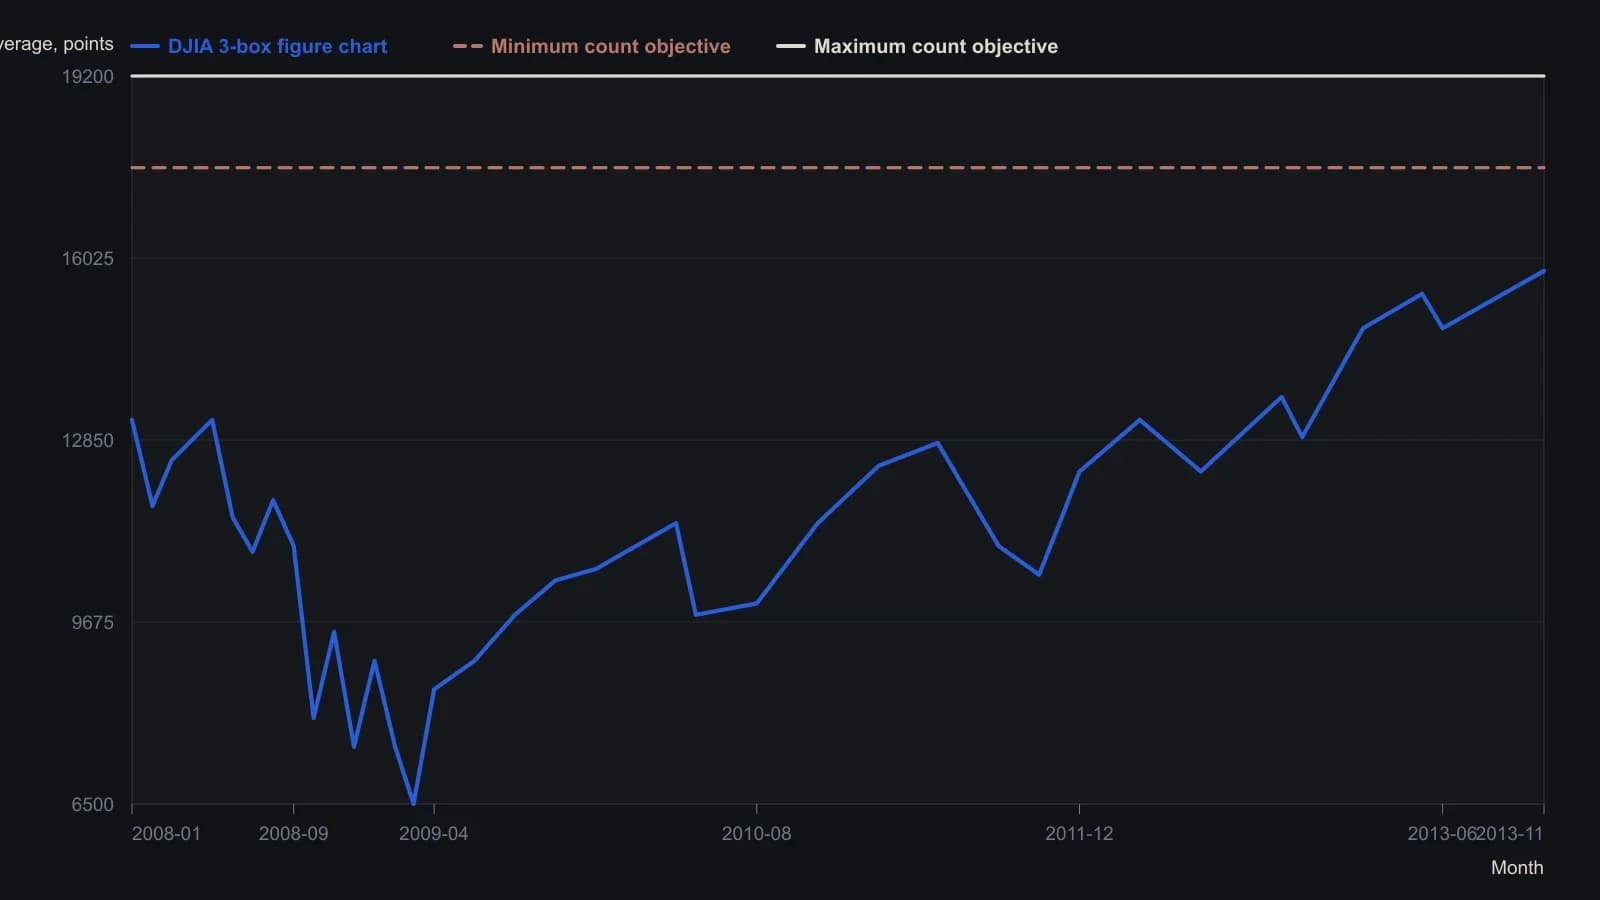
Source figure is arithmetic 3-box reversal, box size 100, High/Low Wyckoff method. Digitized at box resolution from visible column swings; do not treat intermediate months as daily prints. Count uses 37 boxes from the last point of support.
A mid-trend range as reaccumulation
The 2011 range near DJIA 10500-11000 is read as reaccumulation ending at a last point of support near 11400. The range adds 6900 points and targets of 17400-18300 that overlap the original base projection.
That 2011 range is checked against nine reaccumulation tests. The checks include a broken resistance line, expanding volume on rallies, higher highs and higher lows, a completed correction, a consolidation pattern, a stepping-stone count, and a 3:1 reward-to-risk reading at the last point of support.
Three sketched endings
Three 2014-era endings are sketched. One is a narrow-correction spike into a buying climax inside the target zone. Another is a crowning range that holds a support line until laggard demand is exhausted. A third is a roughly 20 percent shakeout, then reaccumulation toward 19200.
Editorial reading
TradersWeek editorial: teach this long bull as inventory work. Measure the cause on a figure chart at the last point of support. Then treat every later range as either a confirming stepping-stone or a support-and-resistance crown.
If the range keeps passing the reaccumulation tests, it rebuilds cause and can confirm the original projection. If volume expands while price oscillates between the same bounds and laggard demand is absorbed along the lower line, the same support-and-resistance structure is a crowning formation. The lower line is then ice, and a later sign of weakness followed by a rally back to that line marks a last point of supply where the tests flip from buying to selling.
All readings on this track · 21 readings
- 1986Figure-chart construction, counts, and halfway tests
- 1986Constructing Wyckoff trendlines on vertical and figure charts
- 1987Stand down or rehearse on paper when a Wyckoff read fails
- 1987Wyckoff campaign phases as one enter, exit, or stay-out procedure
- 1990Two-bar narrow range as a countdown to the next open
- 1991Channel location as a remaining-room test
- 1991Swing relative strength versus an index proxy
- 1991After a Wyckoff bias, rank leftover cause and keep three-to-one stops
- 1991Timing individual issues to general-market turns
- 1991Constructing a halfway volume map for range resolution
- 1998Wyckoff action sequence as a classroom chart drill
- 1999Hand-plotted point-and-figure trendlines and Wyckoff counts
- 2000Constructing volume confirmation from recent activity
- 2007Diagnose the range on bars, then count it on point and figure
- 2011Wyckoff cause count and spring tests
- 2014Reading the 2008-14 DJIA as a Composite Operator campaign
- 2015Confirm a price-action pivot only after independent signals agree
- 2016A double top stays unfinished until candles show control
- 2016Wyckoff's early clerkship as a campaign-reading case study
- 2016Reading campaign phases as a live drill
- 2017Three clocks on the same crowd life cycle