2000issue C071-5
Constructing volume confirmation from recent activity
Volume is treated as an independent check on price, not as a transform of prices. The construction first sets a recent-activity baseline, then classifies price-volume pairings as normal or abnormal so a reversal idea can be tested rather than inferred from a visual impression.
- Treat volume as an independent variable that confirms or fails to confirm price action, not as a statistical transform of prices.
- Read volume change against the recent past and from the overall volume trend, because isolated sessions and long-horizon activity levels are not comparable.
- Treat expanding volume with rising prices and contracting volume with falling prices as the default. Contrary pairings are abnormal warnings of a possible trend reversal.
- Construct a selling climax as air-clearing activity that need not be the final low, and treat a later near-inactive test as constructive. A parabolic expansion in price and volume is exhaustion.
Volume as an independent confirmation variable
Volume-price analysis treats volume as an independent variable from price. Volume is used to confirm or fail to confirm price action rather than as a statistical transform of prices.
Every completed trade matches one buyer with one seller. Price change is attributed to the relative urgency of the two sides, not to an imbalance in traded quantity.
Set a recent-activity baseline
Volume change is interpreted relative to the recent past, because long-horizon activity levels are not comparable across different listing and market-structure eras.
Rising or falling volume is read from the overall volume trend, not from isolated sessions that fail to confirm surrounding activity.
Normal and abnormal price-volume pairings
The default construction is that volume expands with rising prices and contracts with falling prices. Contrary pairings are treated as abnormal and as warnings of a possible trend reversal.
In bullish trends, volume is described as normally leading price.
A rising-price, falling-volume pairing is constructed as a lack of aggressive buying rather than as sustainable demand, and is commonly associated with bear-market rallies.
A falling-price, expanding-volume pairing is constructed as aggressive selling that buyers are not absorbing, including volume expansion on the first days after a rally starts to slip.
Climax, later test, and exhaustion
A selling climax is framed as air-clearing activity that is usually followed by a rally and need not mark the final low. A later test is treated as constructive when volume shrinks to near inactivity versus the climax.
Record volume coming off an important low is treated as evidence of a sentiment reversal. A simultaneous parabolic expansion in price and volume is treated as exhaustion typically followed by a sharp decline.
Mexico Fund share price, November 1995–July 1996
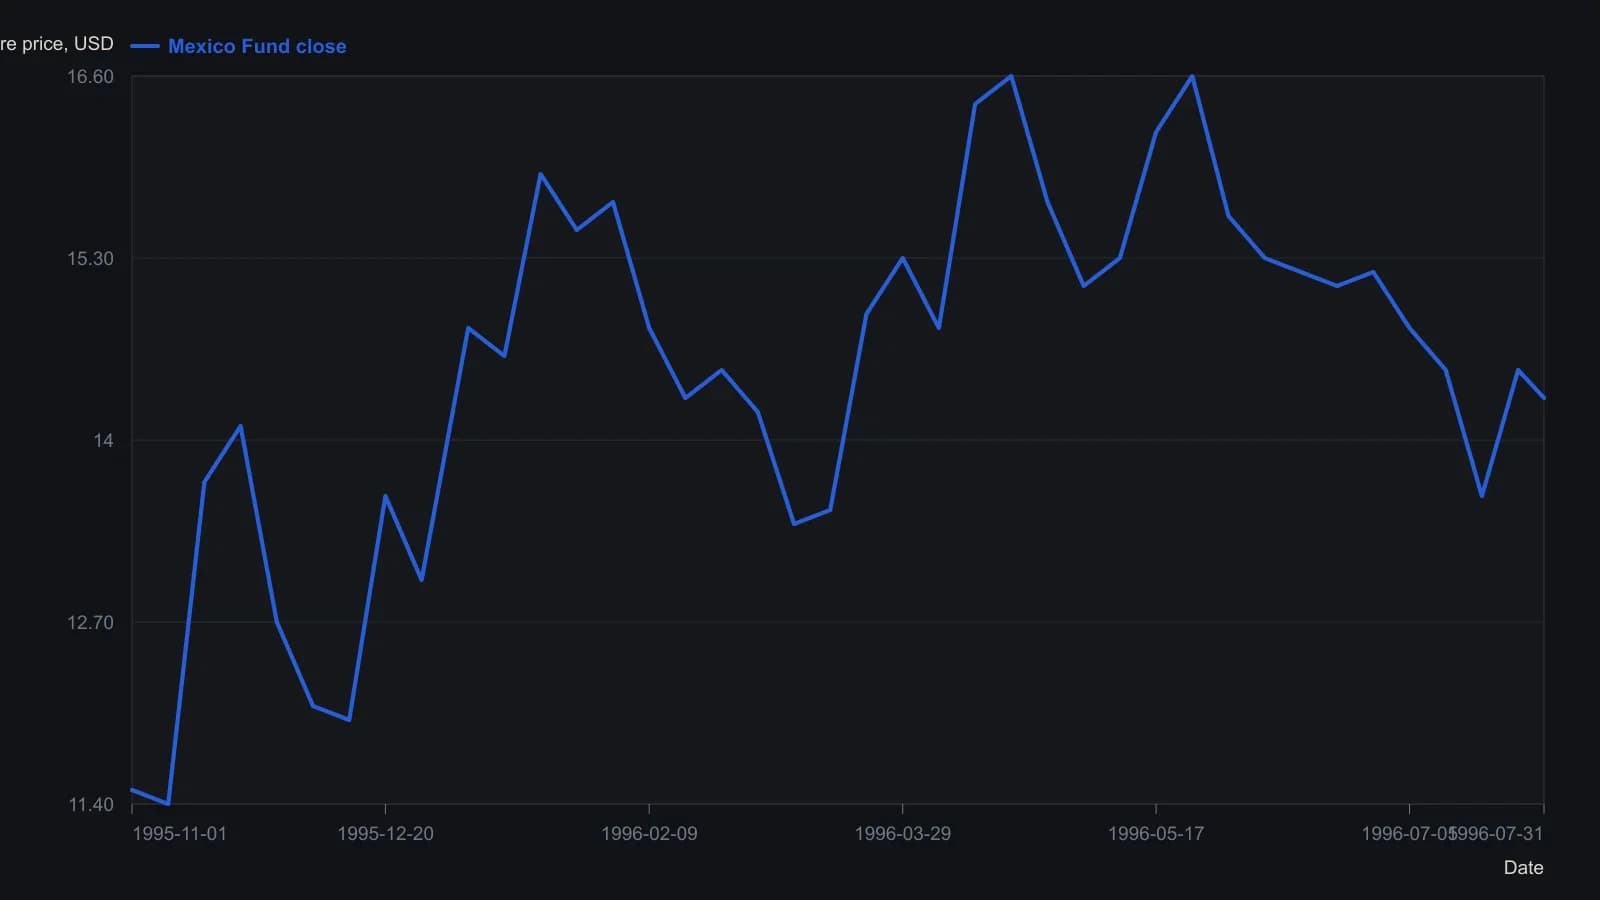
Approximate reads from the printed 11–17 scale; expect about 0.1 error. The source ×10 volume histogram is omitted so two incompatible units are not forced onto one axis.
All readings on this track · 21 readings
- 1986Figure-chart construction, counts, and halfway tests
- 1986Constructing Wyckoff trendlines on vertical and figure charts
- 1987Stand down or rehearse on paper when a Wyckoff read fails
- 1987Wyckoff campaign phases as one enter, exit, or stay-out procedure
- 1990Two-bar narrow range as a countdown to the next open
- 1991Channel location as a remaining-room test
- 1991Swing relative strength versus an index proxy
- 1991After a Wyckoff bias, rank leftover cause and keep three-to-one stops
- 1991Timing individual issues to general-market turns
- 1991Constructing a halfway volume map for range resolution
- 1998Wyckoff action sequence as a classroom chart drill
- 1999Hand-plotted point-and-figure trendlines and Wyckoff counts
- 2000Constructing volume confirmation from recent activity
- 2007Diagnose the range on bars, then count it on point and figure
- 2011Wyckoff cause count and spring tests
- 2014Reading the 2008-14 DJIA as a Composite Operator campaign
- 2015Confirm a price-action pivot only after independent signals agree
- 2016A double top stays unfinished until candles show control
- 2016Wyckoff's early clerkship as a campaign-reading case study
- 2016Reading campaign phases as a live drill
- 2017Three clocks on the same crowd life cycle