2018issue C0229
Implied volatility as an option-premium construction gauge
Implied volatility is the volatility a pricing model infers when it is inverted on a live option quote. Placing that reading in its own history is presented as a way to judge whether listed options are relatively cheap or expensive before a premium-buying or premium-selling structure is chosen.
- Implied volatility is the volatility output obtained when an options pricing model is given an option’s current market price and solved for volatility rather than for a theoretical price.
- A higher observed option price produces a higher implied volatility, and a lower observed option price produces a lower implied volatility, because larger embedded time premium maps to a higher reading.
- Each listed option has its own implied volatility, while practitioners often average implied volatility across the options on one underlying and compare that average with the same series’ historical range.
- High implied volatility is treated as evidence that a large amount of time premium is built into option prices, and a historically low reading is framed as a cheap-premium regime in which constructions that buy time premium are typically preferred.
Inverting a pricing model for implied volatility
Implied volatility is the volatility output obtained when an options pricing model is given an option’s current market price and solved for volatility rather than for a theoretical price.
The Black-Scholes model is presented as a standard pricing model that can compute a theoretical fair value for a call or put from strike, underlying price, time remaining to expiration, an interest rate, expected dividends if any, and a volatility input. The same model can be inverted on the live quote so that the unknown is volatility instead of price.
When that model is inverted on the live quote, a higher observed option price produces a higher implied volatility and a lower observed option price produces a lower implied volatility.
Time premium inside the quoted price
An option’s market price is described as intrinsic value plus extrinsic value. Intrinsic value is the in-the-money amount, equal to how far the underlying already sits beyond the strike. The extrinsic component is also called time premium, the compensation demanded for taking the risk of selling the option.
Larger embedded time premium corresponds to higher implied volatility, and smaller embedded time premium corresponds to lower implied volatility. High implied volatility is treated as evidence that a large amount of time premium is built into option prices, while low implied volatility is treated as evidence that much less time premium is built in.
Cheap or expensive against its own history
Each listed option has its own implied volatility, while practitioners often average implied volatility across the options on one underlying. Comparing a security’s current average implied volatility with that same series’ historical range is presented as an objective way to judge whether its options are relatively cheap or expensive.
A historically low implied-volatility reading, illustrated by 90-day at-the-money implied volatility on a gold-miners exchange-traded fund making a new four-year low, is framed as a cheap-premium regime in which constructions that buy time premium are typically preferred.
GDX 90-day at-the-money implied volatility, 2013–2017
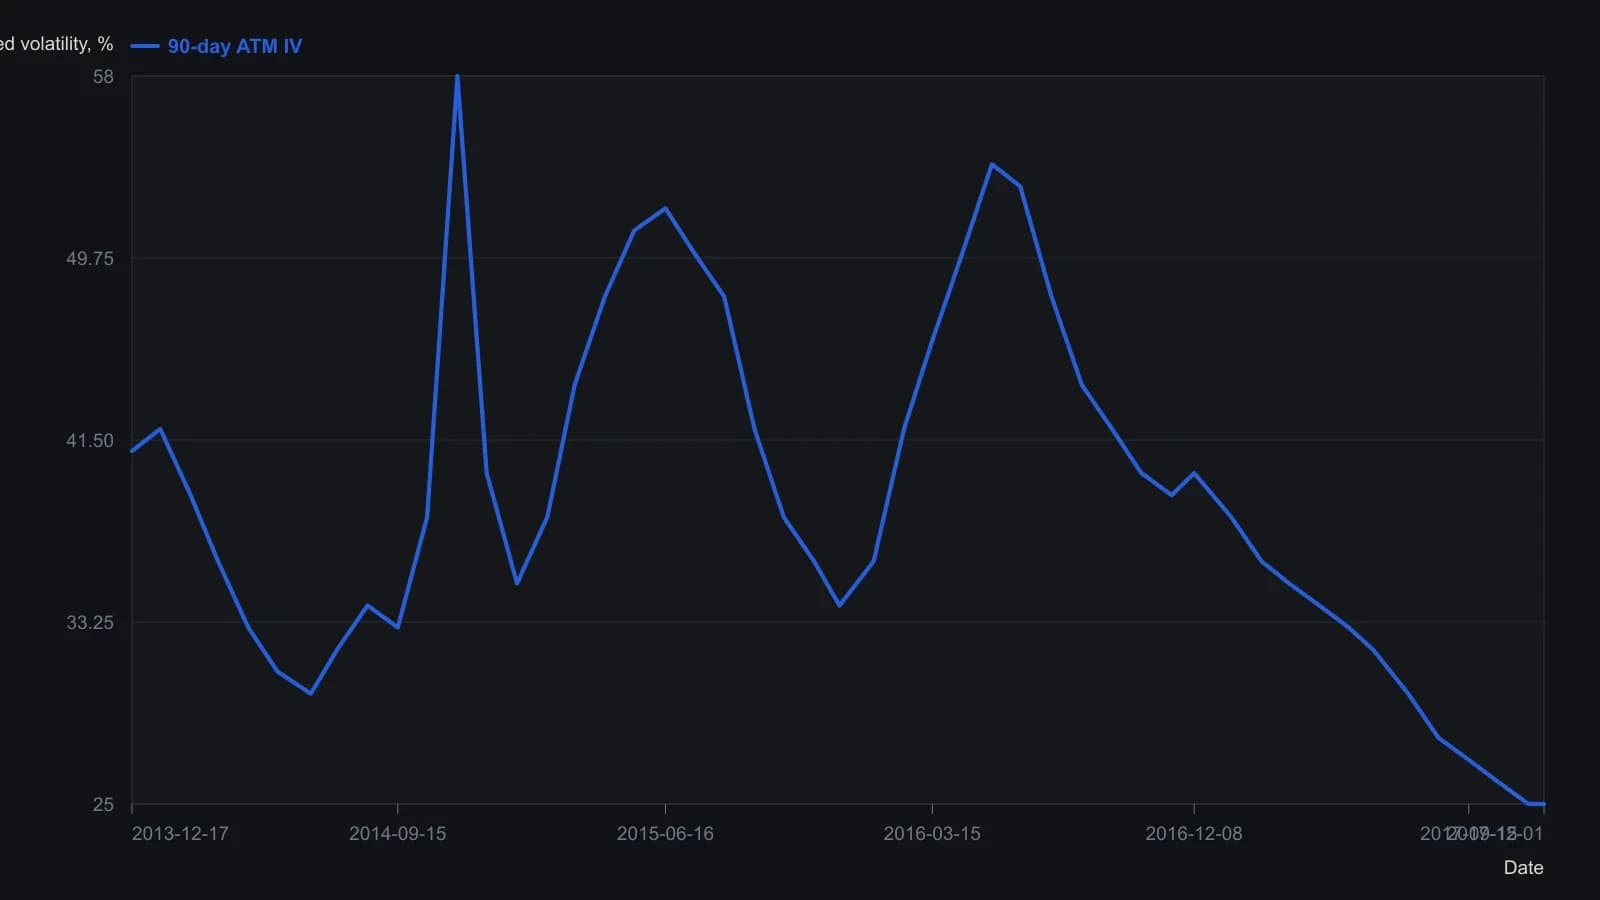
Digitized from the plotted >90-day ATM IV line. Last printed IV is the 25 label at the right edge; earlier points are approximate monthly readings from the raster and should not be treated as exact prints. GDX candlesticks on the left scale were not carried over because the archive chart has a single y-axis.
All readings on this track · 18 readings
- 1988Critiquing Black-Scholes early exercise on futures options
- 1988Constructing option premiums against a Black-Scholes baseline
- 1989Limit fills around option fair value
- 1990When volatility skews are regimes, not mispricings
- 1994Estimating closeout value on a Treasury bond options strangle
- 1996Constructing option theta from premium, volatility, and moneyness
- 2002Calendar income from volatility skew and time stops
- 2003Constructing option value from historical and implied volatility
- 2004Calendar construction from exercise style, time budget, and carry
- 2005A mid-life payoff chart is a volatility-regime assumption
- 2005Exotic option payoffs beyond the vanilla premium
- 2006Auditing index volatility inputs in call income studies
- 2008Ratio write delta adjustment when the tape rises
- 2010Expiration-dated volatility cones as portfolio context
- 2015Auditing buy-write recovery overlays against pricing and scenario breaks
- 2015Odd-lot mini-option hedges versus implied volatility
- 2018Implied volatility as an option-premium construction gauge
- 2019Black-Scholes construction from a covered-call balance sheet