2014issue C0340-44
Ichimoku cloud, market breadth, and dominant cycle detection as a case study
A historical product case study can be read as a research protocol. A named Ichimoku cloud event, a market breadth overlay, and a dominant cycle detection forecast become one falsifiable hypothesis instead of three standalone signals.
- A daily Ichimoku cloud can be generated from a named chart event so later price paths are summarized as a probability band rather than a single forecast line.
- The cloud construction reports a sample-size-dependent margin of error, so fewer matching events imply a wider uncertainty band around the displayed path.
- Market breadth can be applied to ten sectors and to the full market, including an advancer-decliner count restricted to one sector universe.
- Editorial reading: restate the Ichimoku cloud event, the market breadth overlay, and a dominant cycle detection forecast as one hypothesis that can be confirmed or rejected.
The cloud as a repeatable chart condition
A daily Ichimoku cloud display can be generated from a named chart event so that later price paths are summarized as a probability band rather than a single forecast line. The cloud construction reports a sample-size-dependent margin of error, so fewer matching events imply a wider uncertainty band around the displayed path.
Selecting a recent instance of a defined event can zoom a daily chart and open the associated cloud, with the header restating the exact conditions used. A projected cloud after a defined event can be opened from a chosen arrowhead so the same event definition is reused as a repeatable chart condition.
The product case study frames the cloud tool as a way to inspect indicator behavior across a wide class of events. That framing supports treating the Ichimoku cloud as a signal-output overlay on OHLC structure.
Daily QQQ price while Stochastics Overbought events printed
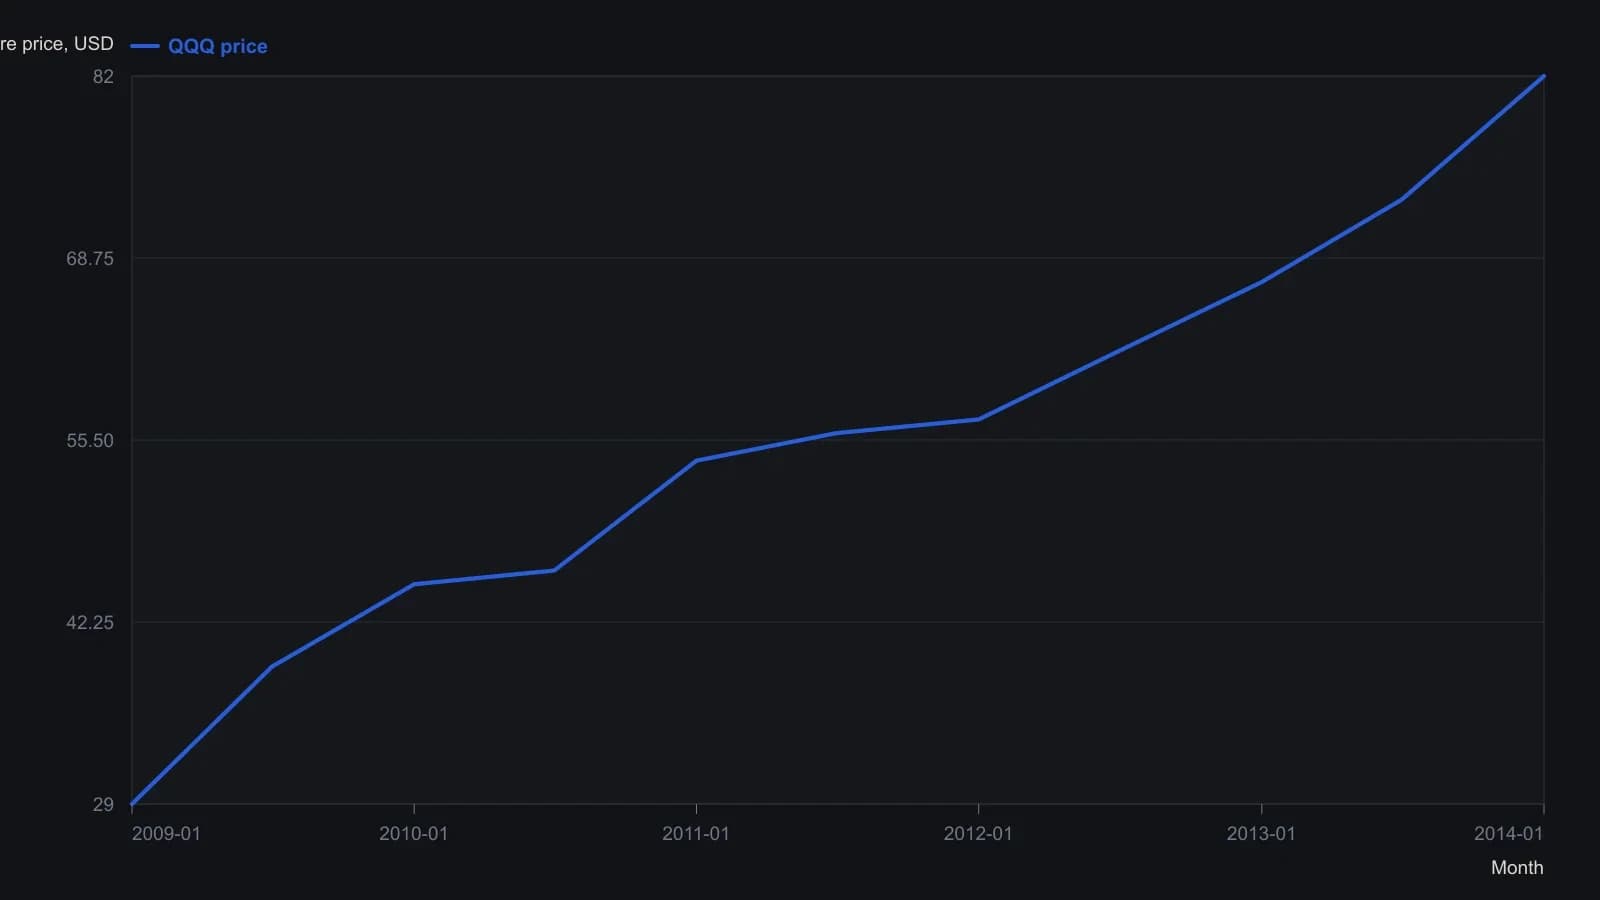
Yellow markers are event timestamps, not long or short entries. The review cites 34 daily QQQ samples of this condition. Values are whole-dollar readings from a compressed raster, not official prints.
Market breadth as a companion overlay
Market breadth calculations can be applied to ten sectors and to the full market, including an advancer-decliner count restricted to one sector universe. A multi-country economic layout can present GDP-growth histograms for ten countries as a complementary breadth-style business-cycle panel.
The archive presents those layouts beside the cloud. It does not, by itself, turn each breadth count into a separate trading signal.
One hypothesis instead of three signals
Editorial reading: Dominant cycle detection should not be treated as a second, independent alert. It is a forecast method that uses ordered price, volume, or breadth observations over a defined sampling interval and lookback. The useful step is to write one hypothesis that names the Ichimoku cloud event, states the market breadth overlay, and includes that forecast as a condition to compare with a later result.
Editorial reading: The same event definition already reused by the projected cloud is the natural place to attach the other two tools. If the Ichimoku cloud, the market breadth overlay, and the dominant cycle detection forecast are not written as a single claim, each display stays a standalone signal and the protocol cannot be falsified as a whole.
All readings on this track · 9 readings
- 2000Constructing Ichimoku spans, scaled oscillators, and volume breakout filters
- 2000Constructing Ichimoku clouds from midpoints and time shifts
- 2007Ichimoku as a time-linked trend and support stack
- 2007A failed support plunge as a classroom case
- 2013Swing entry rules as one testable procedure
- 2014Ichimoku cloud, market breadth, and dominant cycle detection as a case study
- 2015Correction or reversal: a stacked Elliott-wave, Ichimoku, and triangle reading
- 2017Build an Ichimoku cloud from five plots
- 2017Ichimoku cloud price alignment as bullish confirmation