2013issue C0514-21
Swing entry rules as one testable procedure
A swing long or short is allowed only when eight conditions clear together. The same checklist can later close the trade, with a trailing stop or profit target taking the place of the unused risk check.
- The swing-strategy-checklist allows a long or short only when all eight conditions are met together.
- A close through the eight-day exponential average is a cue to inspect the remaining rules, not a standalone order.
- Turning-point-location and wave-one-or-three-context keep the setup near a band or average and on an expected first or third zigzag leg.
- Close-rule-reuse applies the same list to exit, then replaces the unused risk check with a trailing stop or profit target.
One procedure, not one trigger
A swing-strategy-checklist is the eight jointly required conditions that decide whether a swing long or short is allowed. In this workflow, rule-based-entry means that complete set of entry, exit, and abstention conditions rather than a single trigger.
A swing entry is allowed only when all eight conditions are met together: an eight-day exponential-average close break, a valid candle pattern at the last turning point, a turning point near a volatility band or average, an expected zigzag wave 1 or 3, oscillator support, favorable support and resistance, a close through the last possible trendline, and acceptable trade risk.
The daily working template
The daily working template stacks candlesticks, 50-, 100-, and 200-day simple averages, an eight-day exponential average, volatility bands, a percentage- and volatility-adjusted zigzag, Bollinger Band %b, and a stochastic oscillator.
A long requires the last close above the eight-day exponential average. A short requires that close below it. That first break is treated as a cue to inspect the remaining rules rather than as a standalone order.
Daily close versus the 8-day EMA and the 50- and 100-day averages
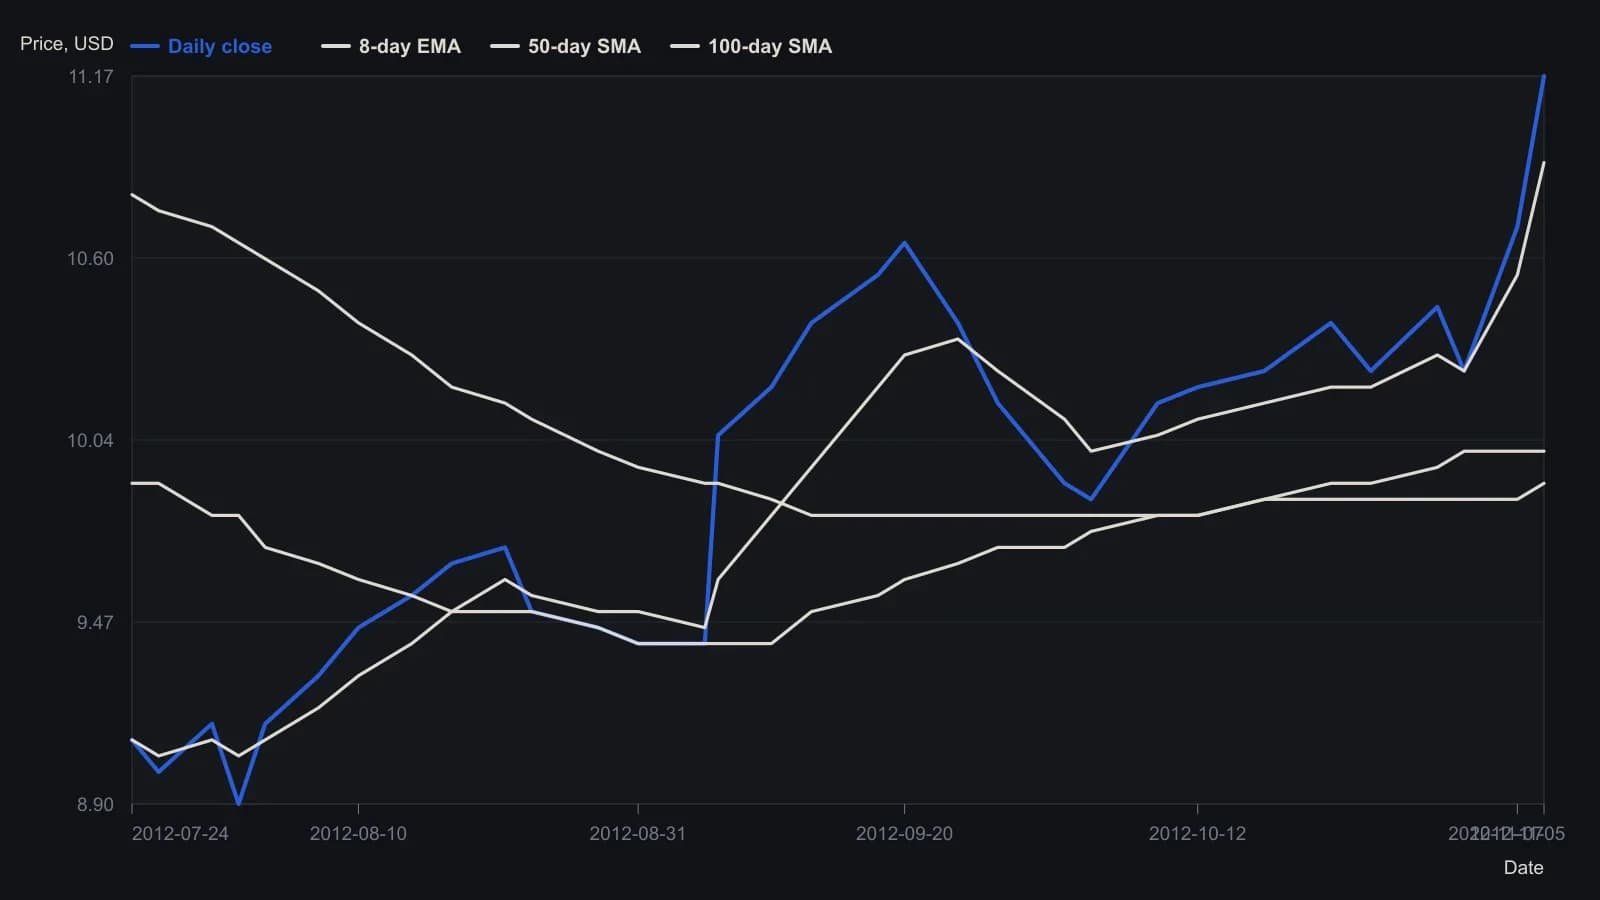
Daily overlays follow the article: 8-day EMA, 50-day SMA, 100-day SMA. Volatility bands, zigzag, and the lower-pane oscillators were not digitized (different scale or too faint to read honestly). The print does not name the symbol or year; month ticks run August–November in a May 2013 issue, so dates are assigned to 2012.
Pattern, location, and wave context
The last pivot must show a reversal candle, illustrated as a bullish harami at a low. Confirmed zigzag pivots are letter-labeled so pattern identity can be checked later.
The last turning point must sit close to a volatility band or a moving average. That turning-point-location rule stays in force if the pivot is near the average instead of the outer band. About one-third of moves are expected not to start from the outer band, so the average-proximity alternative remains part of the same location rule.
Editorial note: TradersWeek files this repeatable price-location condition under ichimoku-cloud, the named taxonomy method for turning a chart-structure overlay into a falsifiable trade hypothesis. The archive itself specifies only a pivot near a volatility band or a moving average.
Only an expected zigzag wave 1 or 3 is admissible. That wave-one-or-three-context filter can still allow a new wave 1 up after a completed 1-2-3 decline when the correction is large and price-indicator divergence is present.
What a short still has to clear
A short additionally needs oscillators falling from overbought, support above and resistance below favoring the short, a close through the last possible uptrend line, and risk still inside acceptable limits.
Reuse the list, then trail
The same eight-rule list can close an open long or short. Close-rule-reuse applies that checklist in reverse, except the risk-limit rule is dropped and replaced by a trailing stop or profit-target method once most close conditions are already met.
Editorial note: a trailing-stop is used here as the post-entry bound that replaces the pre-trade risk check once most close conditions are already in place.
Full-rule compliance is presented as the best chance of success. The procedure still treats exceptions as expected because no rule set is claimed to be perfect.
All readings on this track · 9 readings
- 2000Constructing Ichimoku spans, scaled oscillators, and volume breakout filters
- 2000Constructing Ichimoku clouds from midpoints and time shifts
- 2007Ichimoku as a time-linked trend and support stack
- 2007A failed support plunge as a classroom case
- 2013Swing entry rules as one testable procedure
- 2014Ichimoku cloud, market breadth, and dominant cycle detection as a case study
- 2015Correction or reversal: a stacked Elliott-wave, Ichimoku, and triangle reading
- 2017Build an Ichimoku cloud from five plots
- 2017Ichimoku cloud price alignment as bullish confirmation