2017issue C0120-23
Build an Ichimoku cloud from five plots
Ichimoku is built from five plots that encode trend, line crossovers, support and resistance, stop placement, and a forward projection of the same price structure. A constructed long or short reading requires those plots to align around a conversion-baseline cross and the cloud.
- Ichimoku is built from five plots that together encode trend, line crossovers, support and resistance, stop placement, and a forward projection of the same price structure.
- A constructed long signal requires the conversion line to cross above the baseline while the conversion line, baseline, and price are all above the cloud; the opposite alignment is the short-side counterpart.
- Price above the cloud is an uptrend location, and a rising leading span A above leading span B is treated as a strengthening uptrend inside that location.
- A complete bullish construction stacks the lagging span above price, the conversion line above the baseline, leading span A above leading span B, and price above the cloud; a complete bearish construction inverts each of those four conditions.
Five plots that encode the same price structure
Ichimoku is built from five plots that together encode trend, line crossovers, support and resistance, stop placement, and a forward projection of the same price structure.
The conversion line is the high-low midpoint over a default 9-bar window. The baseline is the high-low midpoint over a default 26-bar window. Those two lines are commonly labeled Tenkan-sen and Kijun-sen.
The lagging span is the close shifted back 26 bars, commonly labeled Chikou span. The two leading spans are shifted forward 26 bars. Leading span A is the average of the conversion line and the baseline. Leading span B is the 52-bar high-low midpoint. The cloud is the band between those two leading spans, used as a location filter for price and the other lines.
Conversion, baseline, and a constructed cross
Viewed alone, the conversion line and the baseline behave like a short-versus-long moving-average pair. The shorter line above the longer line is treated as a positive trend condition.
A constructed long signal requires the conversion line to cross above the baseline while the conversion line, the baseline, and price are all above the cloud. The opposite alignment is treated as the short-side counterpart.
Cloud location, support, and the lagging span
Price above the cloud is treated as an uptrend location. A rising leading span A above leading span B is treated as a strengthening uptrend inside that location.
When price is trending above the cloud and both the conversion line and the baseline sit above the cloud, all four of those lines plus the two leading spans are read as support. The inverse stack in a downtrend is read as resistance.
The lagging span is bullish when it sits above contemporaneous price and bearish when it sits below that price.
The complete four-part stack
A complete bullish construction stacks the lagging span above price, the conversion line above the baseline, leading span A above leading span B, and price above the cloud. A complete bearish construction inverts every one of those four conditions.
Agilent Technologies daily with Ichimoku cloud
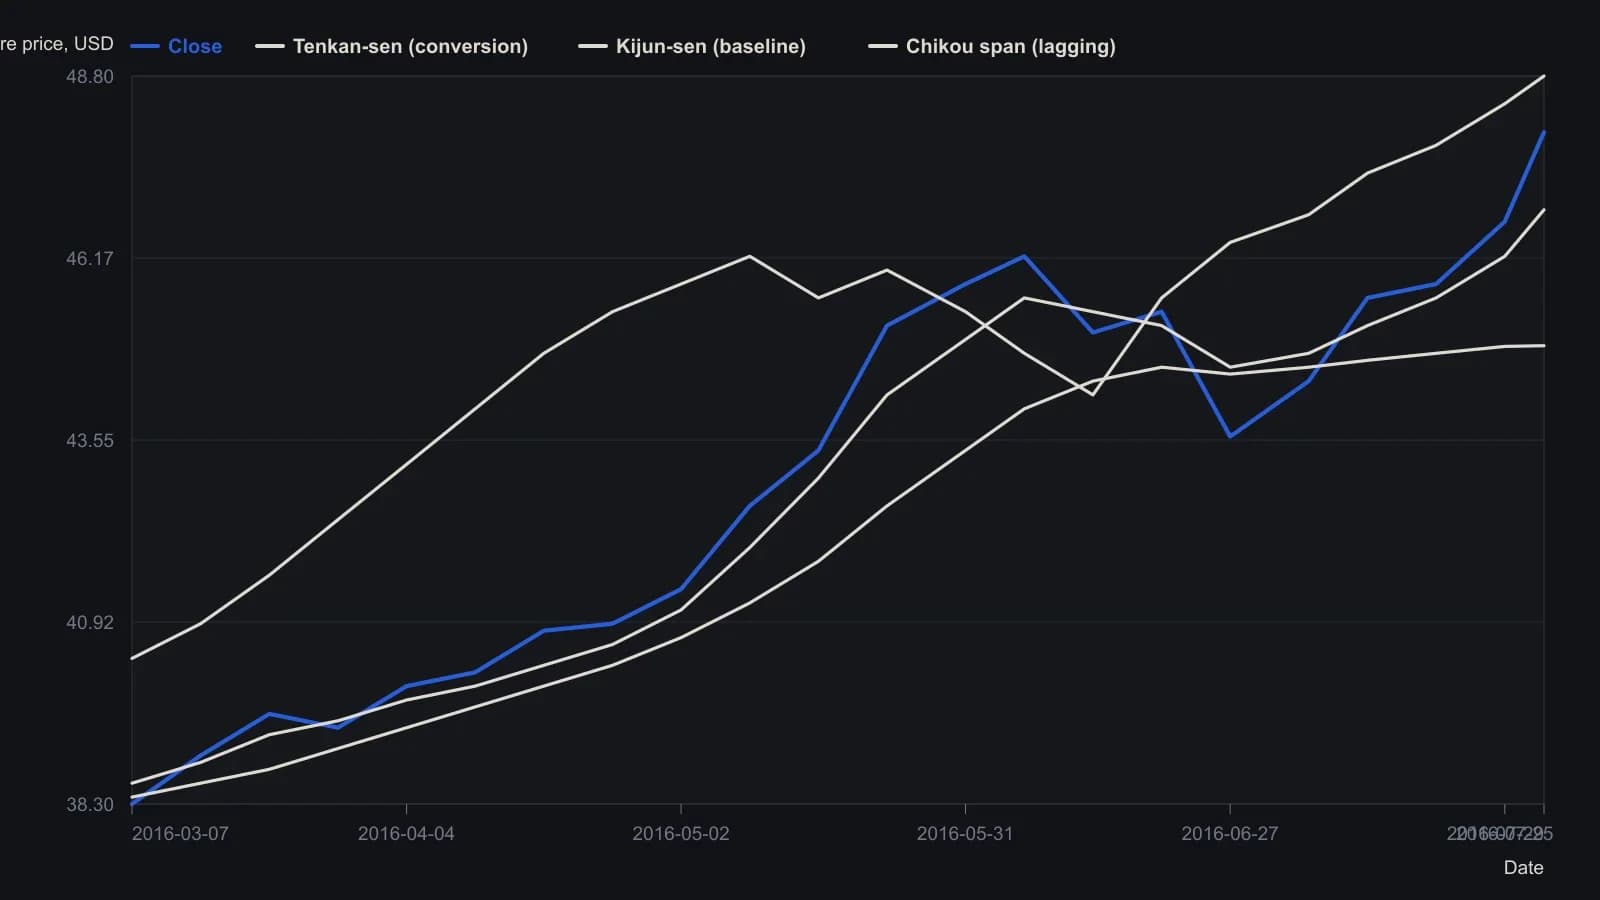
Daily OHLC plus Ichimoku defaults (9/26/52). Cloud and conversion/baseline overlays were sampled from the raster; prices are approximate to about 0.2. Header last print 47.99.
All readings on this track · 9 readings
- 2000Constructing Ichimoku spans, scaled oscillators, and volume breakout filters
- 2000Constructing Ichimoku clouds from midpoints and time shifts
- 2007Ichimoku as a time-linked trend and support stack
- 2007A failed support plunge as a classroom case
- 2013Swing entry rules as one testable procedure
- 2014Ichimoku cloud, market breadth, and dominant cycle detection as a case study
- 2015Correction or reversal: a stacked Elliott-wave, Ichimoku, and triangle reading
- 2017Build an Ichimoku cloud from five plots
- 2017Ichimoku cloud price alignment as bullish confirmation