2007issue C091-3
Ichimoku as a time-linked trend and support stack
The overlay is four moving-average-type lines plus a fifth lagging close, read together rather than as standalone oscillators. The nine- and 26-period averages use each bar's midpoint, the cloud is plotted ahead as time-shifted support and resistance, and the lagging close is checked against prior candles.
- The overlay is four moving-average-type lines plus a lagging close, read together rather than as standalone oscillators.
- The nine- and 26-period averages are built from each bar's midpoint; shorter above longer is an upward bias, the reverse is a downward bias, and those same lines later flip from support to resistance after the trend turns.
- Senkou span A and senkou span B are plotted 26 periods ahead to form the cloud. A thin cloud is treated as a weaker barrier, and a decisive close through the far edge is treated as a medium- to longer-term trend signal.
- Chikou span plots the latest close 26 periods backward as an extra support or resistance check, and the same 9, 26, 52, 26 construction is used on weekly candles, where cloud edges still matter even if the crossover rule is treated as unreliable inside a long triangle.
Four lines and a lagging close
The overlay is built from four moving-average-type lines plus a fifth lagging close. Those parts are read together rather than as standalone oscillators.
A moving average is a lookback smoother of ordered price. In this overlay the primary pair uses each bar's midpoint rather than its close, and companion spans carry that information forward or back in time.
Midpoint averages set the bias
The nine- and 26-period averages are calculated from each bar's midpoint, not from closing prices. Midpoint price is the high plus low divided by two.
The 26-period window is explained as matching an older Japanese market month of about 26 working days when Saturday morning sessions were still included.
Shorter-average above longer-average is read as an upward bias, and the reverse as a downward bias. Those same averages later flip roles from support to resistance after the trend turns.
Nikkei 225 versus its Ichimoku stack, March 2007
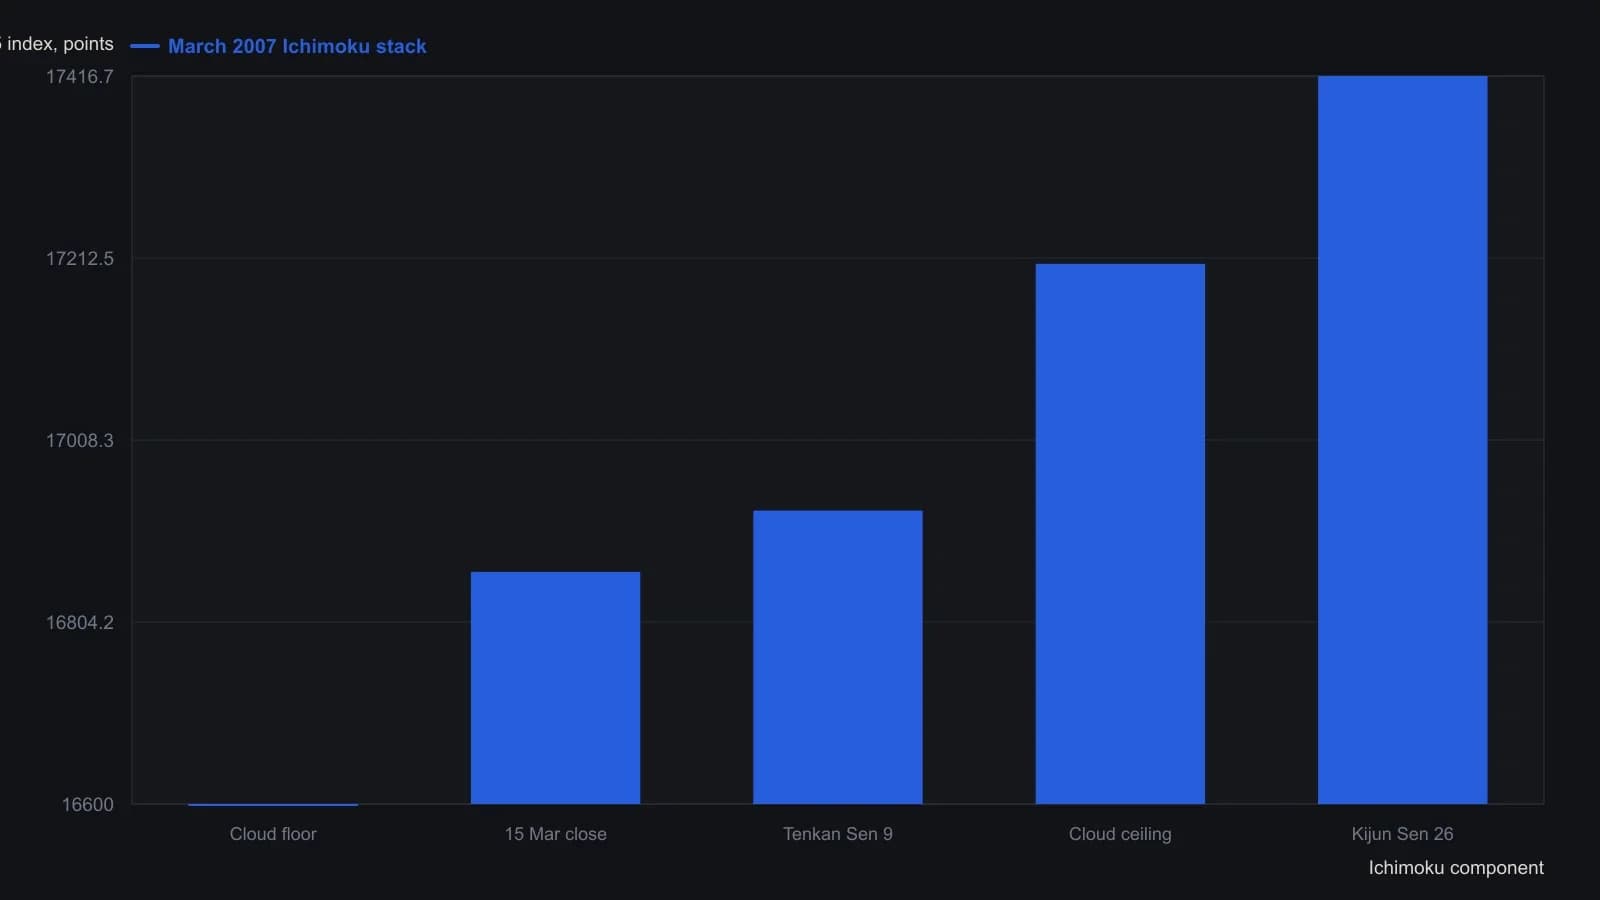
Tenkan and Kijun use each session’s midpoint, (high+low)/2, not the close. The 26-period length is the old six-day Japanese working month. Cloud edges here are the March band price actually tested (16,600 floor, 17,206 ceiling), not the 19 April forward senkou pair.
The cloud maps support and resistance ahead
Senkou span A is the average of those two midpoints plotted 26 periods ahead of the last completed bar. Senkou span B is the midpoint of the 52-period high and low, also plotted 26 periods ahead. The shaded space between them is the cloud.
The cloud is a shaded band between two spans plotted ahead of the last completed bar. It maps time-shifted support and resistance instead of a single level on the current candle.
Cloud thickness is the vertical width of that band. A thin cloud is treated as a weaker barrier and a higher chance of a medium-term trend change. A thick band is treated as a stronger barrier. The vertical gap from candles to the cloud is not treated as an overbought or oversold reading.
A decisive close through the far edge of the cloud is treated as a medium- to longer-term trend signal. Mixed readings are allowed when the averages and the cloud disagree.
The lagging close checks earlier candles
Chikou span is the latest close plotted 26 periods backward. It is treated as an extra support or resistance check against prior candles and the cloud.
Support and resistance, in this workflow, are repeatable pause or turn zones read from cloud edges, the two midpoint averages, and prior candle bodies, including where the lagging close meets those features.
The same construction on weekly candles
The same 9, 26, 52, 26 construction is applied to weekly as well as daily candles. Weekly cloud edges are used as support and resistance even when the average-crossover rule is described as unreliable inside a long triangle.
All readings on this track · 9 readings
- 2000Constructing Ichimoku spans, scaled oscillators, and volume breakout filters
- 2000Constructing Ichimoku clouds from midpoints and time shifts
- 2007Ichimoku as a time-linked trend and support stack
- 2007A failed support plunge as a classroom case
- 2013Swing entry rules as one testable procedure
- 2014Ichimoku cloud, market breadth, and dominant cycle detection as a case study
- 2015Correction or reversal: a stacked Elliott-wave, Ichimoku, and triangle reading
- 2017Build an Ichimoku cloud from five plots
- 2017Ichimoku cloud price alignment as bullish confirmation