2000issue C101-8
Constructing Ichimoku spans, scaled oscillators, and volume breakout filters
The archive specifies an ichimoku-cloud from high-low midpoints and forward preceding-span values, a 4-versus-8 moving-average-oscillator with four later scalers, and a single-bar breakout-scan that joins price, range, and volume-multiple tests.
- The standard-line, turning-line, and second preceding-span are high-low midpoints over 26, 9, and 52 bars. The first preceding-span is the midpoint of the standard-line and turning-line, and both spans are plotted forward by the standard lookback to form the ichimoku-cloud.
- A delayed-line reading can be encoded by coloring the turning-line from whether the close is above the delayed close, and plotting the forward cloud requires unused space to the right at least as large as the standard lookback.
- A moving-average-oscillator can be a 4-versus-8 difference of the close, or another indicator in that place, then scaled by an 8-period standard deviation, average-true-range, or average of price or of the oscillator, or mapped into a 200-period high-low range multiplied by 100.
- A long breakout-scan requires the close above 20, 50-bar average volume above 500, the close above the prior 5-bar extreme, the close at least 1 unit above the previous close, and volume above 1.5 times that average. The short form keeps those floors and reverses the extreme and 1-unit tests.
Three constructions on one tape
The archive specifies three constructions from the same OHLC and volume tape: an ichimoku-cloud, a moving-average-oscillator that can be scaled later, and a breakout-scan that must pass every price and volume test on one bar.
The cloud uses a standard-line, a turning-line, a delayed-line, and two preceding-span values. The oscillator starts as a short-versus-long simple-average difference of the close. The scan is a single-bar conjunction.
Standard-line, turning-line, and delayed-line
The standard-line is the midpoint of the highest high and lowest low over 26 bars. The turning-line uses the same midpoint rule over 9 bars.
The delayed-line is the close displaced by the standard lookback. That displacement is implemented as a 25-bar or 26-bar shift depending on the reconstruction.
A delayed-line reading can be encoded by coloring the turning-line from whether the close is above the delayed close.
Preceding-span values and the ichimoku-cloud
The first preceding-span is the midpoint of the standard-line and the turning-line, displaced forward. The second preceding-span is the 52-bar high-low midpoint, displaced by the same standard lookback.
The ichimoku-cloud is the band between those two preceding-span values, read as a chart-scale condition. Plotting the forward cloud requires unused space to the right at least as large as the standard lookback.
One confirmation and trigger
One Ichimoku signal construction treats the close above both spans as long confirmation and a turning-line cross above the standard-line as the trigger.
The lookbacks can be restated for a five-session week near 7 and 22 bars.
The raw moving-average-oscillator
A simple moving-average-oscillator can be built as a 4-versus-8 difference of the close.
That raw series can be replaced by another indicator before any scaler is applied.
Four oscillator-normalization scalers
Four documented scalers divide that oscillator by an 8-period standard deviation, an 8-period average-true-range, or an 8-period average of price or of the oscillator. A fourth scaler maps the oscillator into a 200-period high-low range multiplied by 100.
Average-true-range is the mean of the greatest of high minus low, high minus prior close, and prior close minus low, and it is used here as a volatility divisor.
Long and short breakout-scan conjunctions
A long breakout-scan is the conjunction of the close above 20, 50-bar average volume above 500, the close above the prior 5-bar extreme, the close at least 1 unit above the previous close, and volume above 1.5 times that 50-bar average.
The matching short filter keeps the same price and volume floors but requires the close below the prior 5-bar extreme and at least 1 unit below the previous close.
Some reconstructions take that 5-bar extreme from high and low rather than from close. The 1.5 test is the volume-multiple on the same 50-bar average volume.
Breakout-scan closes on 21 January 2000
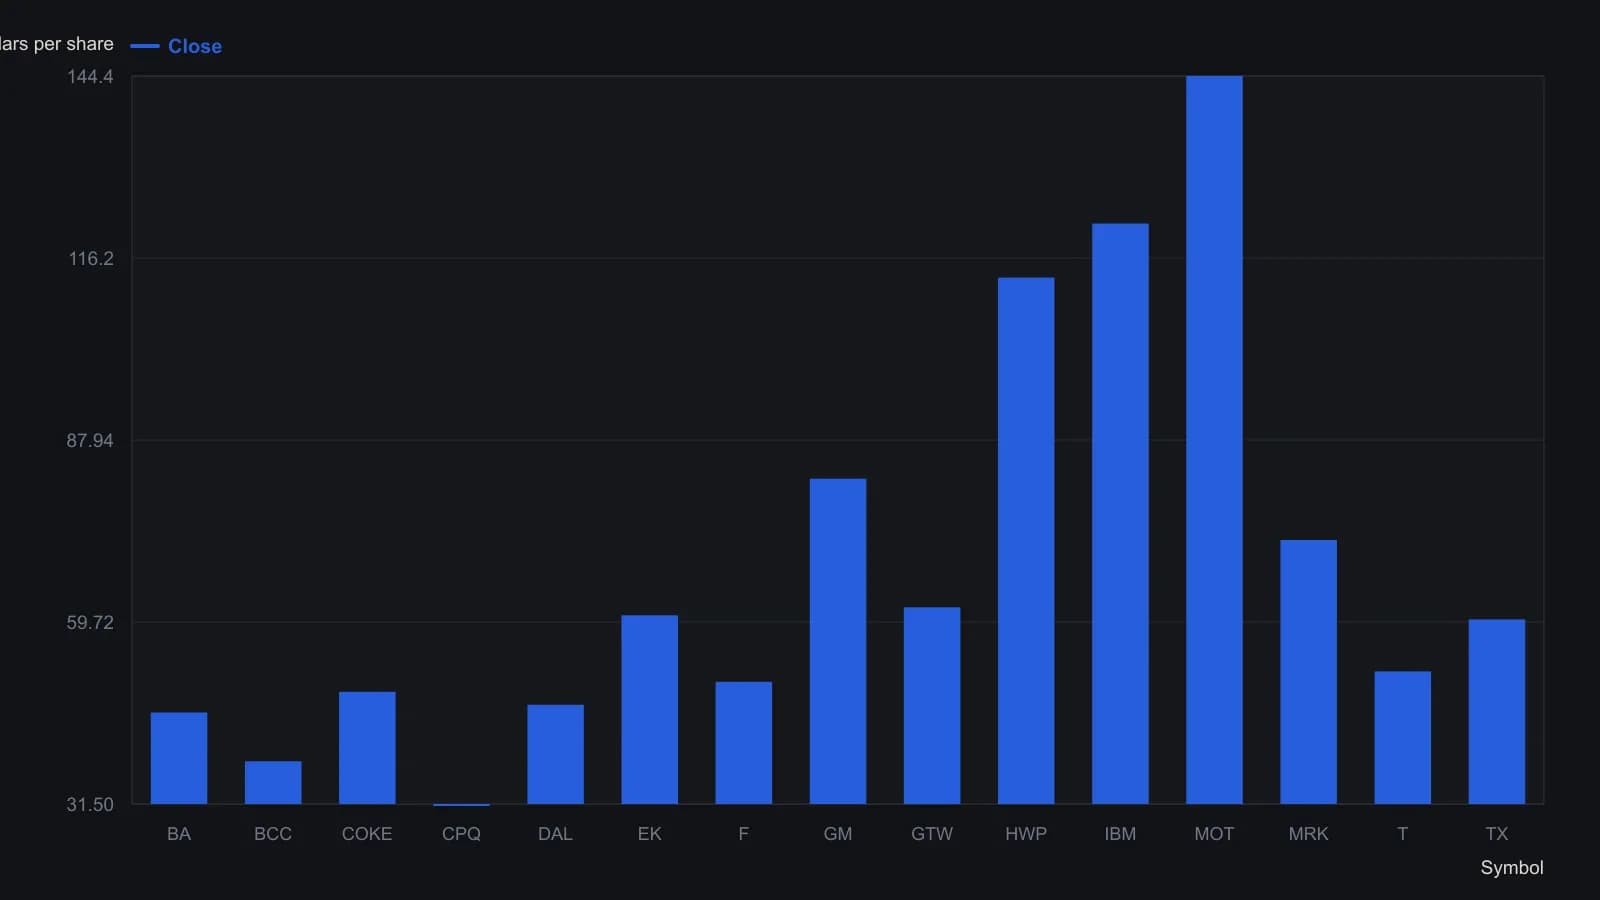
Long and Short are 0/1 outputs of the five-way filter: close above 20, 50-day average volume above 500, close beyond the prior five-day extreme, a move of more than one point from the prior close, and volume at least 1.5 times the 50-day average.
All readings on this track · 9 readings
- 2000Constructing Ichimoku spans, scaled oscillators, and volume breakout filters
- 2000Constructing Ichimoku clouds from midpoints and time shifts
- 2007Ichimoku as a time-linked trend and support stack
- 2007A failed support plunge as a classroom case
- 2013Swing entry rules as one testable procedure
- 2014Ichimoku cloud, market breadth, and dominant cycle detection as a case study
- 2015Correction or reversal: a stacked Elliott-wave, Ichimoku, and triangle reading
- 2017Build an Ichimoku cloud from five plots
- 2017Ichimoku cloud price alignment as bullish confirmation