2012issue C0822-31
Four-level risk sizing when stock margin caps fixed fractions
A fixed-risk rule raises dollar risk after profits and cuts it after losses. Overnight stock buying power can still block the share count a large fraction implies, so the four-levels-strategy switches among a few risk percentages instead of forcing one target.
- Fixed-risk sizing is an antimartingale: dollar risk rises after profits enlarge the account and falls after losses shrink it.
- Overnight stock buying power is typically limited to 2:1, so margin-limitation can make the share count implied by a large risk fraction unaffordable.
- The four-levels-strategy treats 20% of trading capital as the maximum stock risk fraction and selects among four discrete percentages as recent results and market constraints change.
- Optimal-f on the sample sat at 50.21%, but stock-price limits blocked that fraction, and simulated profit was no better than simpler rules.
Fixed-risk and the overnight cap
A fixed-risk rule sizes the next position so a planned stop risks a chosen percentage of current account equity. The archive presents that rule as an antimartingale: dollar risk rises after profits enlarge the account and falls after losses shrink it.
A martingale raises exposure after losses. The archive uses martingale as the contrast class against antimartingale and stepped-risk rules.
Overnight stock buying power is described as typically limited to 2:1. A high-priced name can then make the share count implied by a large risk fraction unaffordable. That is the margin-limitation that keeps a chosen fraction from becoming the risk actually taken.
When a 30% target becomes a 5.4% fill
In the MasterCard walk-through, a $360 entry, a $340 stop, a $10,000 account, and a 30% target risk implied 150 shares and $54,000 of notional. Available capital allowed only 27 shares and about 5.4% account risk.
Because stock prices often cap achievable risk, the four-levels-strategy treats 20% of trading capital as the maximum risk fraction for stocks. That stock-specific money-management rule selects among four discrete risk percentages according to recent trade results and market constraints.
The same 20 trades under several fractions
On a 20-trade April 2007–April 2008 stock sample with 10 winners and 10 losers, buying or shorting the maximum under 2:1 margin produced $1,637 net profit and a 30.21% maximum drawdown.
The same sequence sized at a constant 5% account risk produced about $1,317 net profit and 11% drawdown, versus about $2,477 net profit and 21% drawdown at a constant 10% risk.
A fixed-risk scan of that sequence placed the growth-maximizing fraction at 13.8%, with 24.5% maximum drawdown and $2,564 net gain. Risking above that fraction did not improve results.
An optimal-f calculation on the full sample returned 50.21% and an f-dollar of $25.45 per share. Stock-price limits blocked implementing that fraction, so simulated profit was no better than simpler rules. Optimal-f is a historically fitted fraction of equity that maximized growth on a completed trade sequence, known only after those trades are closed.
The 20% stock ceiling
A 20% risk fraction is shown to cut capital by a third after five consecutive losses, because 0.8 to the fifth power is about two-thirds of starting equity. The archive treats that 20% figure as the maximum risk fraction for stocks, not as a size that buying power will always permit.
5% fixed-risk equity on the 20-trade stock sample
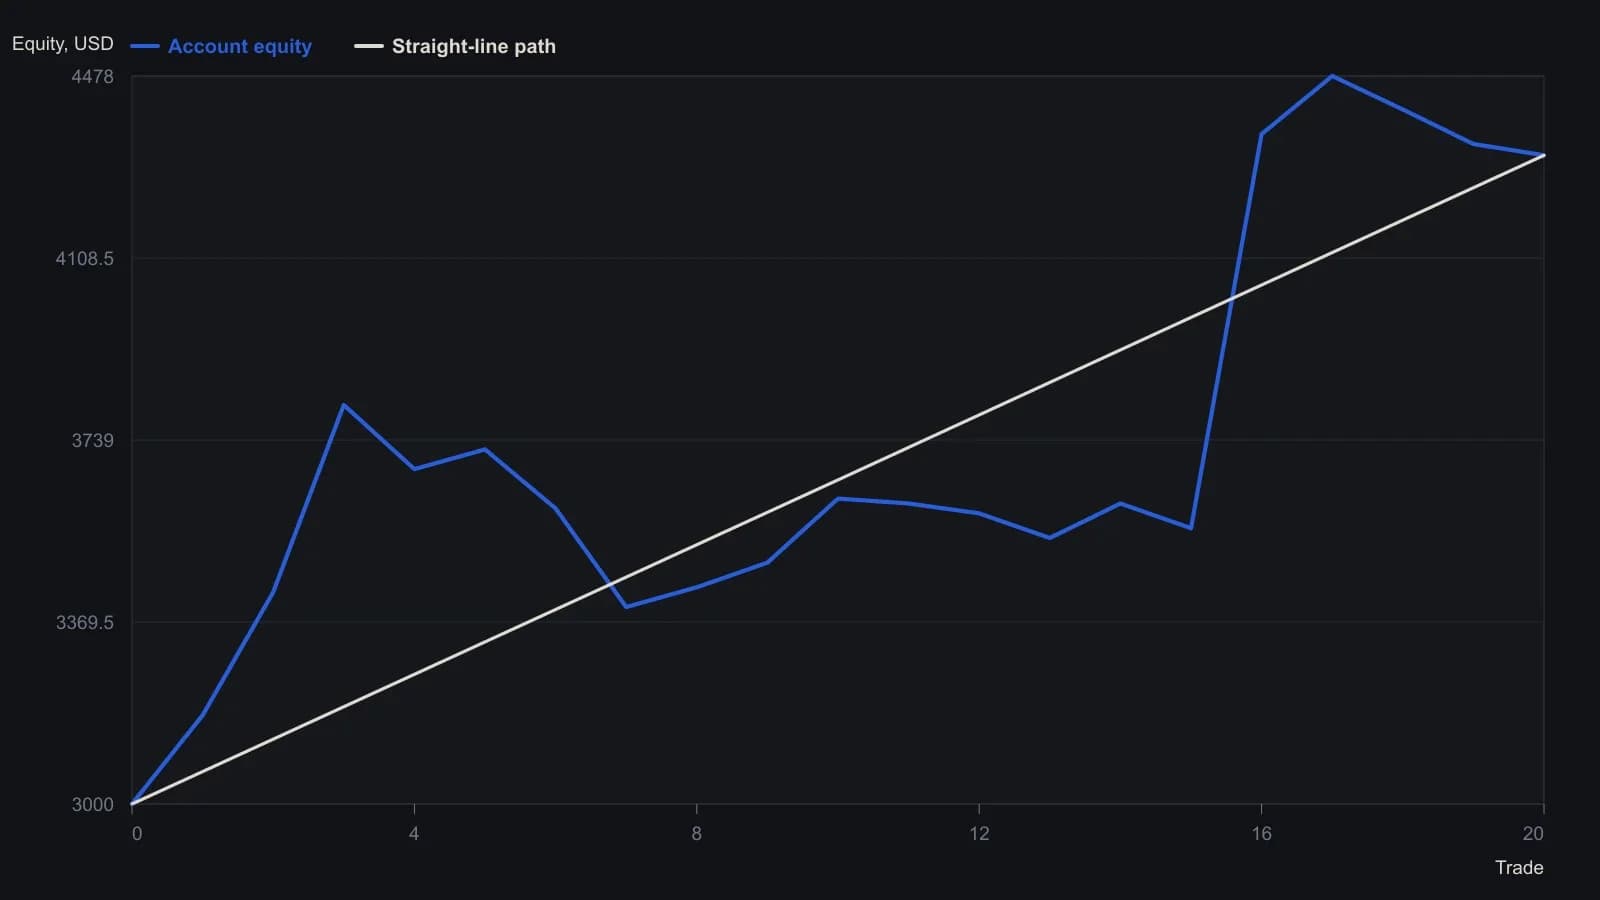
Risk was held at 5% of current equity from a $3,000 start. The author assumed 2:1 overnight stock margin, omitted commissions, and converted ATR into dollar risk per share.
All readings on this track · 9 readings
- 1988Modified-martingale progression lists and ruin bounds
- 1989Scale-in-on-loss on a tempered-martingale-series with a fixed unit-factor
- 1989Shorter series need fewer recovery hits and raise scale-in cash
- 1990Recovery sizing as a series procedure
- 1990Reverse-martingale pyramiding after clustered wins
- 1993Test Martingale against fixed size before you pyramid
- 1998The runs-test as a contract-sizing gate
- 2004Scale-in on a two-close reversal instead of using a price stop
- 2012Four-level risk sizing when stock margin caps fixed fractions