2007issue C071-6
Pairing a double-diagonal overlay with an income butterfly
Archive constructions from 2006 pair a longer-dated double-diagonal overlay with short-dated income structures. A rise in implied volatility that damages condors can improve the longer-dated wings, while an income-butterfly is left to harvest quiet time near a center strike.
- A double-diagonal overlay can be mixed with condor-style income structures because a rise in implied volatility that damages condors can improve the longer-dated wings.
- Filters for the double diagonal include a stock above $30, implied volatility in the lower two thirds of its two-year range, a near/far volatility skew of no more than four points, and avoidance of earnings months and strongly trending names.
- An income-butterfly is a quiet-volatility decay hold near a center strike, usually started about four weeks before expiration; a speculative-butterfly is treated as a short-horizon event packet.
- Management rolls credits at preset curve points, buys credits back under 0.20, takes half the initial cash flow, uses a calendar-spread-adjustment when the view is neutral, and exits when the curve cannot be improved.
Complementary jobs in one book
The archive mixes a double-diagonal overlay with condor-style income structures. A rise in implied volatility that damages condors can improve the longer-dated wings of the diagonal.
A double-diagonal is a front-month short strangle paired with longer-dated long wings one strike farther out, used as a hedged income overlay. An income-butterfly is a short at-the-money body with long wings one strike on each side, held as a time-decay vehicle while price stays near the center strike.
Filters and construction for the double diagonal
Candidate filters for the double diagonal include a stock above $30, implied volatility in the lower two thirds of its two-year range, a near/far volatility skew of no more than four points, and avoidance of earnings months and strongly trending names.
Construction sells the first in-range call and put inside one standard deviation in the front month. It then buys the call one to two months later and one strike higher, and the put one to two months later and one strike lower. Each long wing is capped at one and a half times the short option price.
A long wing priced at more than one and a half times the short option can produce a sagging mid-curve profit profile. Selling a lower call and a higher put is used to restore income and tighten that sag.
SPY double-diagonal P/L with the 126/132 shorts
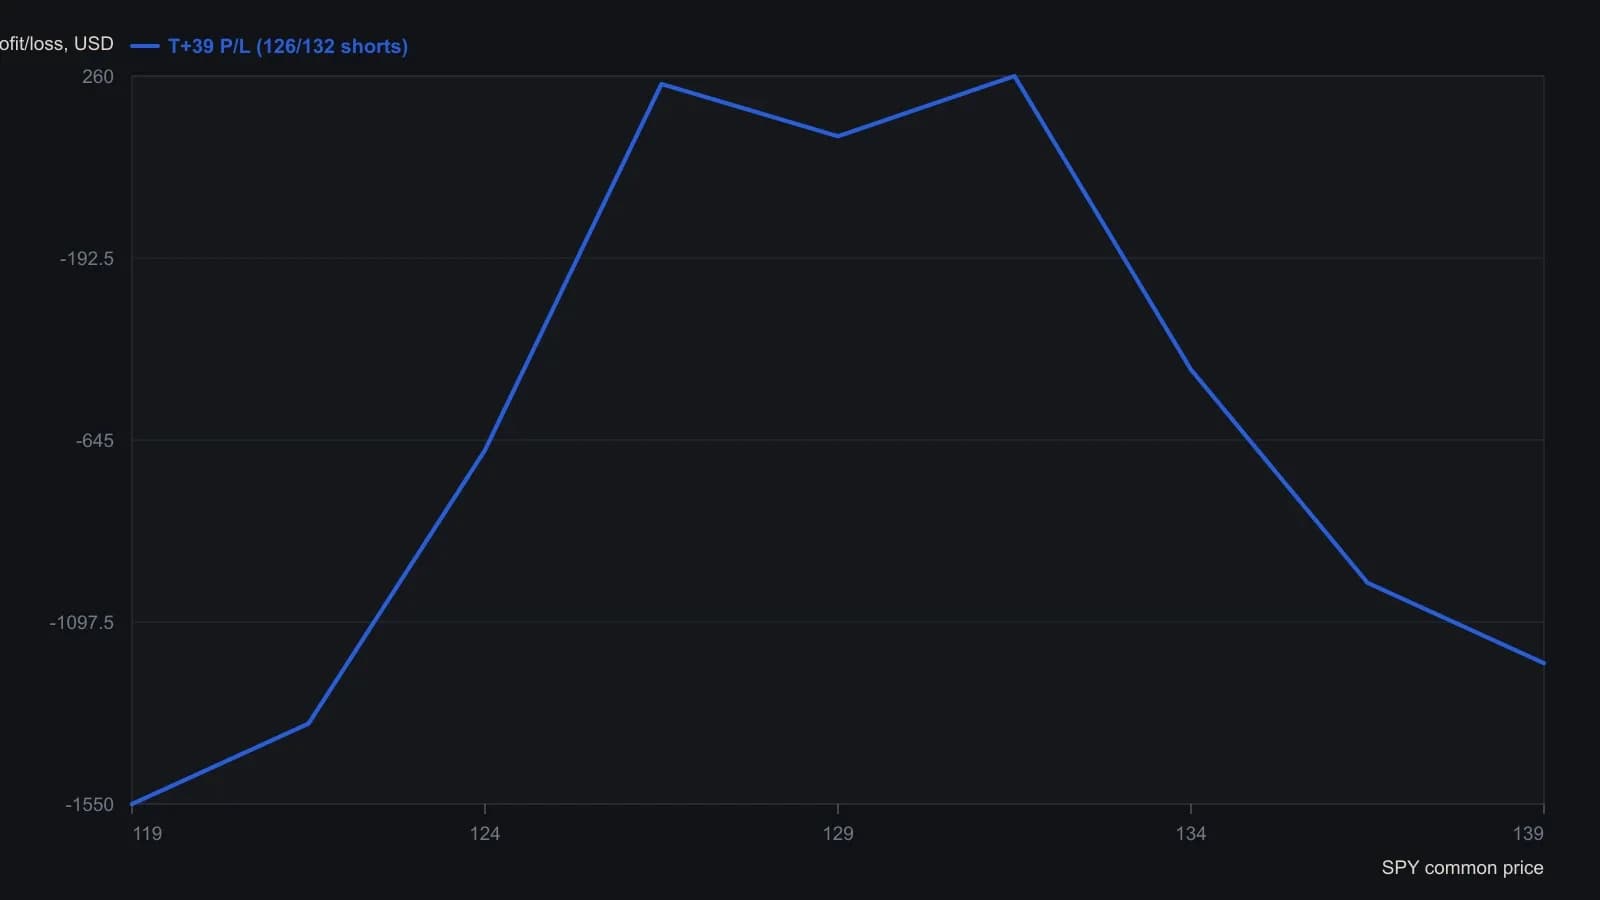
Nine P/L cells read from the analysis table under the graph, aligned to the printed SPY price ticks. Spot marked on the pane is 128.90; capital/requirement is $2,720. The plotted line is the T+39 slice (18 February 2006, 0% vol change).
A documented Whirlpool overlay
A documented October 13, 2006 Whirlpool double diagonal sold 10 November 95 calls and 10 November 80 puts against December 100 calls and December 75 puts for a $0.73 credit, or $730, against $5,000 of stated risk.
Management and calendar-spread-adjustment
Management rules include rolling credits if price reaches preset curve-based points, closing a credit when it can be bought back under 0.20, and taking profits when half the initial cash flow is available.
If the view is neutral, a threatened diagonal is converted into a same-strike calendar. That calendar-spread-adjustment buys in the front-month short and resells the same strike in the next month. The archive exits rather than nursing a curve that cannot be improved.
The income-butterfly as a decay hold
An income-butterfly is built by selling two at-the-money calls and buying one call below and one above. It is typically initiated after earnings have been digested so implied volatility is quiet, and often about four weeks before expiration.
A September 21, 2006 iShares Russell 2000 butterfly bought five 67 calls, sold ten 72 calls, and bought five 77 calls for a $1,070 debit. Profit increased the longer price stayed near the 72 center strike.
That butterfly was closed about two weeks before expiration, from September 29 to October 11, for a 17% return on invested capital. Holding to the October 20 close at 75.60 would have turned the same risk curve into a loss.
The speculative-butterfly as an event packet
A speculative-butterfly is treated as a short-horizon event packet rather than an income hold. One documented put fly sold two 1280 puts at 2.54 each against a 1295 put at 4.89 and a 1265 put at 1.24 for a $1.05 net debit, with a stated payoff profile near 1 to 13.3.
All readings on this track · 18 readings
- 2003Specify a butterfly as one range procedure
- 2006Index volatility alignment, skews, and butterfly construction
- 2006Oil proxies, volatility regimes, and bounded overlays
- 2007Pairing a double-diagonal overlay with an income butterfly
- 2008Range-bound butterfly debit versus iron credit
- 2008Iron butterfly payoff construction in volatile crude
- 2010Constructing directional out-of-the-money butterfly spreads
- 2010Modified butterfly and calendar spreads in high-priced names
- 2011Broken-wing put butterfly: credit, vega, and assignment
- 2013A live-cattle call butterfly is a different risk object than an outright call
- 2017Put butterfly payoff construction from an implied move and premium
- 2017One-day earnings volatility, ratio spreads and butterflies
- 2017Building a staggered broken-wing butterfly book
- 2017Below-the-money butterfly spreads sized by volatility regime
- 2018Why day-one option risk curves misread theta, calendars, and butterflies
- 2019An expected-value filter for defined-risk option spreads
- 2019Failed breakout as a setting for an out-of-the-money put butterfly
- 2020Limited-risk call butterfly construction in volatile oil