2003issue C041-2
Specify a butterfly as one range procedure
A butterfly is a sideways-range structure that sets wings, body, and net-debit as one payoff. The historical workflow then paper-tests identical rules on similar setups before cash is used.
- A butterfly uses only calls or only puts, shorts two contracts at the middle strike, and buys one contract at each outer strike.
- Maximum risk is the net-debit after the short credit is applied, and the break-even prices sit one net-debit inside the wing strikes.
- Wings are located from identified support and resistance, while centering the body is a starting point rather than a rigid rule.
- Paper-trading identical rules on a series of similar setups comes before cash, because first-time losses were attributed mainly to skipped study of volatility and time decay.
A sideways-range structure
A butterfly is a sideways-range structure that uses only calls or only puts. It shorts two contracts at a middle strike and buys one contract at a lower strike and one at a higher strike.
The two short contracts are the body. The two long contracts are the wings. The position is designed around a defined trading range rather than around an isolated long or short contract.
Net-debit, risk, and break-evens
The net-debit is the remaining cash outlay after the credit from the short contracts is subtracted from the cost of the longs. Maximum profit is defined as the short-to-long strike spacing minus that net-debit. Maximum risk is defined as the same net-debit after the short credit is applied.
Break-even prices are calculated by adding the net-debit to the lowest strike and subtracting the same net-debit from the highest strike.
XYZ 40/45/50 put butterfly expiration P&L
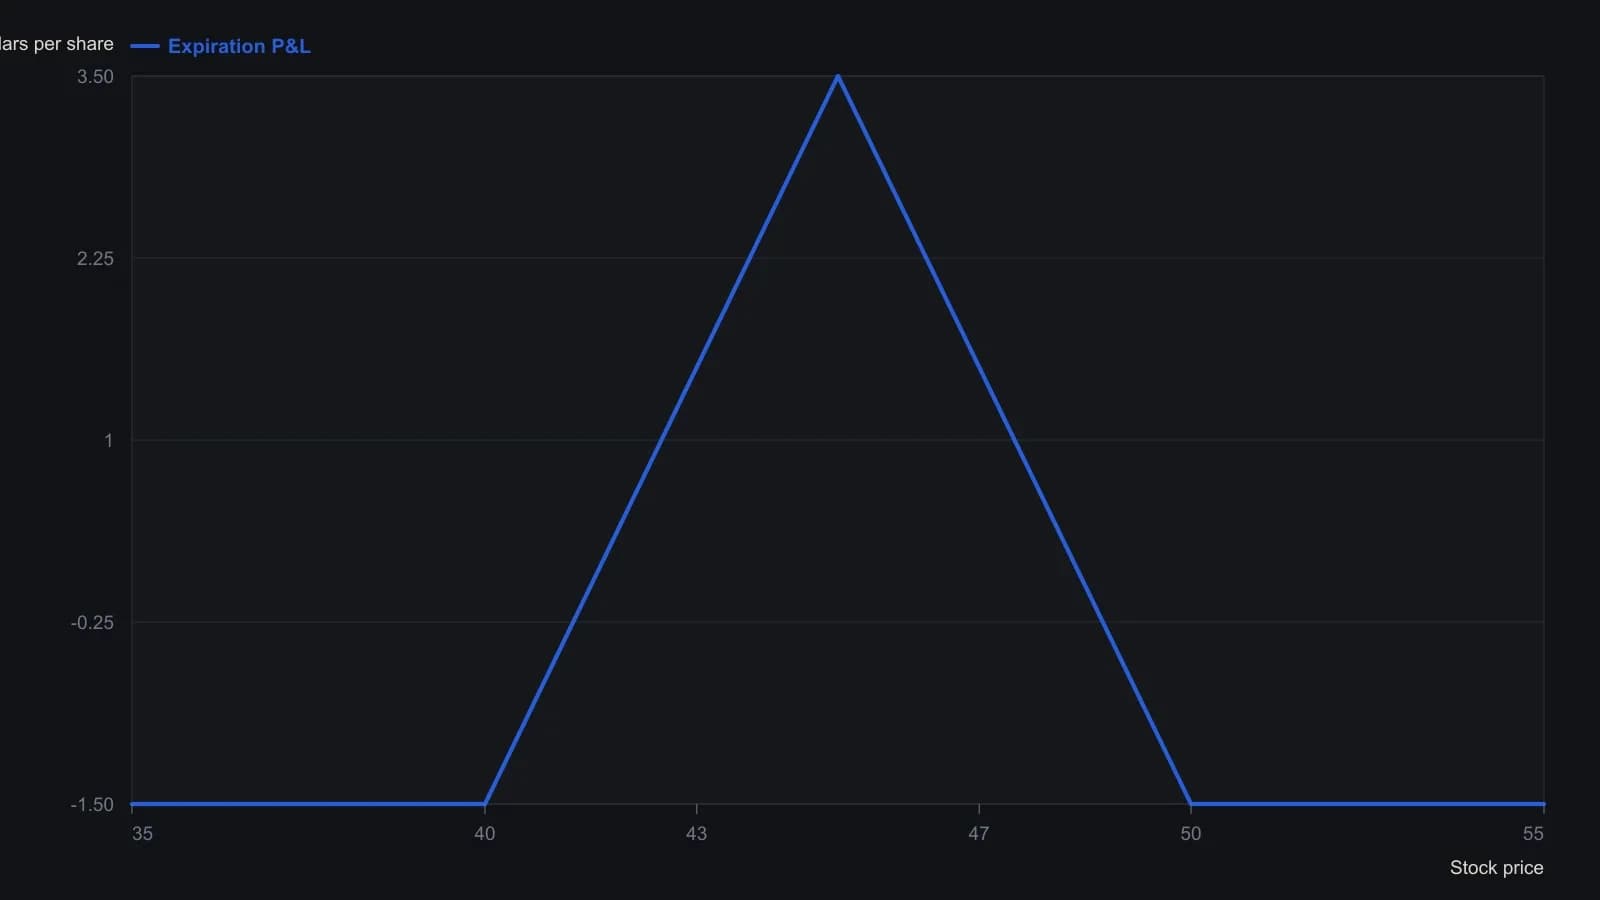
Points are the expiration P&L of one spread at the net debit of 1.50 the article computes. Intermediate prices follow the piecewise-linear butterfly between the stated strikes and break-evens; they are not read off the schematic Figure 1 drawing.
Wings from support and resistance
Wing strikes are located from identified support and resistance. Centering the short body inside that range is presented as a useful starting point rather than a rigid rule.
In the February put example, the 40 and 50 longs cost 6.50, the two 45 shorts credit 5, the net risk is 1.50 per spread, and the stated maximum profit is 3.50 per spread. That same example names a profitable band between 41.50 and 48.50, with the largest payoff if the underlying is at 45.
Implied-volatility after entry
Implied-volatility is the options market priced expectation of movement. A later decline in implied-volatility is described as able to reduce remaining time premium in the short contracts more quickly when that volatility is elevated at entry.
Intraday constraints on option-spreads
Retail traders are described as constrained in intraday option-spread trading by slippage and commissions. Slippage is the gap between the intended fill and the price actually paid or received.
Bull or bear spreads are generally treated as poor daytrade candidates because they typically need several points of underlying movement. Near-expiration options on the 100 and 500 indexes are described as among the more liquid and relatively cheaper contracts, especially when little time premium remains.
Paper-trading before cash
A method is to be paper-tested on a series of similar setups with identical rules before cash is used. First-time losses are attributed mainly to skipping study of volatility and time decay.
Editorial view: paper-trading is a simulated run of identical setups used to inspect the full option-spread procedure. It is not a live-size step.
All readings on this track · 18 readings
- 2003Specify a butterfly as one range procedure
- 2006Index volatility alignment, skews, and butterfly construction
- 2006Oil proxies, volatility regimes, and bounded overlays
- 2007Pairing a double-diagonal overlay with an income butterfly
- 2008Range-bound butterfly debit versus iron credit
- 2008Iron butterfly payoff construction in volatile crude
- 2010Constructing directional out-of-the-money butterfly spreads
- 2010Modified butterfly and calendar spreads in high-priced names
- 2011Broken-wing put butterfly: credit, vega, and assignment
- 2013A live-cattle call butterfly is a different risk object than an outright call
- 2017Put butterfly payoff construction from an implied move and premium
- 2017One-day earnings volatility, ratio spreads and butterflies
- 2017Building a staggered broken-wing butterfly book
- 2017Below-the-money butterfly spreads sized by volatility regime
- 2018Why day-one option risk curves misread theta, calendars, and butterflies
- 2019An expected-value filter for defined-risk option spreads
- 2019Failed breakout as a setting for an out-of-the-money put butterfly
- 2020Limited-risk call butterfly construction in volatile oil