2019issue C0930-31
Failed breakout as a setting for an out-of-the-money put butterfly
A case study uses a failed upside breakout and a low implied-volatility reading as the setting for a July SPY out-of-the-money put butterfly, treating the same 1/-2/1 construction as a directional structure instead of a neutral at-the-money butterfly.
- An out-of-the-money butterfly keeps the same long-one, short-two, long-one construction and equal wing-to-body spacing as a standard butterfly, but every strike sits away from the money.
- The case study treats a failed upside breakout, with implied volatility toward the low end of its historical range, as a setting for a directional put butterfly rather than a neutral at-the-money structure.
- In the July SPY example that buys 288, sells two 264 strikes, and buys 240, the position is described as losing money if the underlying does not decline, while time decay is described as turning helpful once price trades below the higher long put strike.
- Maximum payoff at the short middle strike is called exceedingly unlikely, so a dollar or price target is the usual management path, and a put-side preference is noted because equities are described as often falling faster than they rise and because the structure typically has positive vega.
Same construction, different placement
An out-of-the-money butterfly uses the same long-one, short-two, long-one construction as a standard butterfly, with equal wing-to-body spacing. Every strike is placed away from the money. A conventional at-the-money butterfly is typically framed as a relatively neutral structure meant for an underlying that stays near the middle strike into expiration.
Failed breakout and cheap options
The case study presents a failed upside breakout as one setting for an out-of-the-money put butterfly. Price reaches a prior high and does not follow through, a backdrop often followed by sideways-to-lower trade. After that rally, implied volatility is described as sitting toward the low end of its historical range. The case study treats that reading as relatively cheap options for a net-premium butterfly.
A directional put example
The worked example is a July SPY put butterfly that buys the 288 strike, sells two 264 strikes, and buys the 240 strike. That example is characterized as a purely directional put structure: if the underlying does not decline, the position is described as losing money.
Time decay and the management path
Once the underlying trades below the higher long put strike, about 288 in the example, time decay is described as beginning to work in favor of the butterfly rather than against it. Capturing the theoretical maximum payoff is described as requiring the underlying to settle exactly at the short middle strike at expiration. That outcome is called exceedingly unlikely, so a dollar or price target is presented as the usual management path.
Why the put side is discussed
The case study notes a possible put-side preference because equities are described as often falling faster than they rise. An out-of-the-money butterfly typically has positive vega, and implied volatility often increases when prices decline.
July SPY OTM put butterfly: implied volatility by strike
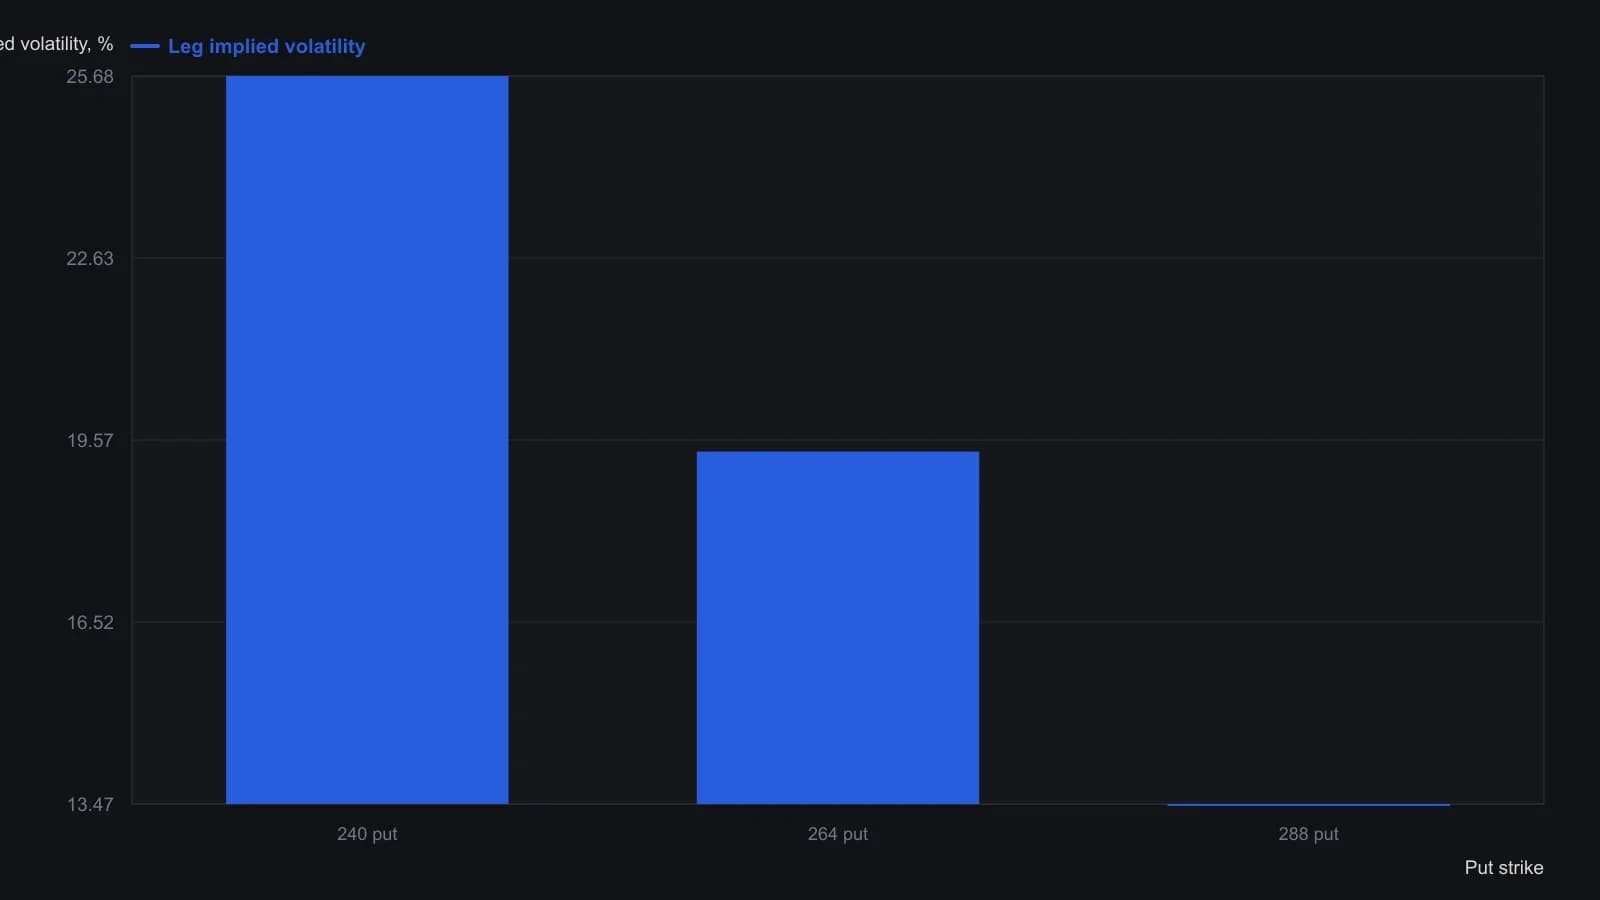
IV, entry, and P&L figures are the Natural quote snapshot on the blotter dated 2019-05-02, with 78 days to the 2019-07-19 expiration. Max profit and max risk are the platform totals for one 1/-2/1 spread, not a mid-price theoretical.
All readings on this track · 18 readings
- 2003Specify a butterfly as one range procedure
- 2006Index volatility alignment, skews, and butterfly construction
- 2006Oil proxies, volatility regimes, and bounded overlays
- 2007Pairing a double-diagonal overlay with an income butterfly
- 2008Range-bound butterfly debit versus iron credit
- 2008Iron butterfly payoff construction in volatile crude
- 2010Constructing directional out-of-the-money butterfly spreads
- 2010Modified butterfly and calendar spreads in high-priced names
- 2011Broken-wing put butterfly: credit, vega, and assignment
- 2013A live-cattle call butterfly is a different risk object than an outright call
- 2017Put butterfly payoff construction from an implied move and premium
- 2017One-day earnings volatility, ratio spreads and butterflies
- 2017Building a staggered broken-wing butterfly book
- 2017Below-the-money butterfly spreads sized by volatility regime
- 2018Why day-one option risk curves misread theta, calendars, and butterflies
- 2019An expected-value filter for defined-risk option spreads
- 2019Failed breakout as a setting for an out-of-the-money put butterfly
- 2020Limited-risk call butterfly construction in volatile oil