2010issue C0234-39
Cross-pair correlation regimes in uncertain markets
A currency cross is easier to place after the two dollar legs are scored together. Correlation analysis measures how those legs move against the dollar, intermarket analysis inverts that reading for the cross, and carry trading is considered only once that regime looks reliable.
- Correlation analysis is applied to the two dollar legs first. Pearson’s product-moment coefficient is the standard linear measure of how those pairs move together, scaled from -1 to +1.
- When two dollar pairs rise together, the corresponding cross is framed as negatively related and is expected to sell off as those legs advance.
- Carry trading is considered only after risk is assessed, because cross and carry trades are described as the first positions abandoned after a housing collapse or a large liquidity injection.
- In uncertain economic conditions the working rule is to stay with dollar pairs and to treat cross pairs as appropriate only after growth returns.
Treat the cross as what remains of two dollar pairs
Editorial reading: treat a currency cross as a regime-conditioned residual of two dollar pairs. The archive workflow first measures how the legs move together against the dollar, then inverts that reading for the cross, and only then asks whether carry trading is even tradeable.
That order keeps intermarket analysis and correlation analysis in front of the carry decision. Regime dependence is the filter: the same cross can look ordinary when the dollar legs travel together and unreliable when growth prospects, or the coefficient itself, start to shift.
Score how the dollar legs move together
Pearson’s product-moment coefficient is presented as the standard linear measure of how two currency pairs move together. It is scaled from -1 to +1 and is described as covariance divided by the product of the pairs’ standard deviations.
A high-80s to low-90s coefficient is treated as near-perfect positive co-movement. Readings in the 20s to 30s are treated as negative co-movement. Perfect +1 or -1 relationships are described as rare in currency pairs.
In the September window cited, EUR/USD and AUD/USD showed one-, three-, and six-month absolute values of 0.74, 0.76, and 0.72. Those figures are read as the euro and Australian dollar moving together against the dollar most of the time over those horizons.
Invert that reading for the cross
When two dollar pairs rise together, the corresponding cross is framed as negatively related. EUR/AUD is shown trending down after 12 April 2009 while EUR/USD trends up, so the cross is expected to sell off as the dollar legs advance and to rise as those legs fall.
EUR/USD and GBP/USD are given September absolute values of 0.75, 0.73, and 0.66 over one, three, and six months. EUR/GBP is therefore expected to weaken when both dollar pairs rise with the dollar. Intermarket and spreads work is doing the same job in both examples: place the cross only after the dollar legs have been read.
Ask whether carry is even tradeable
Cross and carry trades are described as the first positions abandoned after a housing collapse or a large liquidity injection, leaving remaining holders exposed. Risk must be assessed before a cross-pair trade is considered.
GBP/AUD is used as a risk case. The pair normally shows strong correlation and a 2.5% interest-rate gap, yet British economic uncertainty and weak data made the absolute values unreliable, so traders would not commit capital despite carry potential.
Absolute values and correlations are said to shift when growth prospects change. The one-year AUD/USD versus USD/JPY reading is given as 0.48, while the short-term relationship is described as barely measurable.
Stay with dollar pairs when growth is uncertain
Currency pairs are also tied statistically to equities, Treasury yields, the VIX, and option risk reversals. Interest rates are named as the persistent driver of both crosses and straight dollar pairs.
In uncertain economic conditions the working rule is to stay with dollar pairs and to treat cross pairs as appropriate only after growth returns.
GBP/USD daily rate, April–October 2009
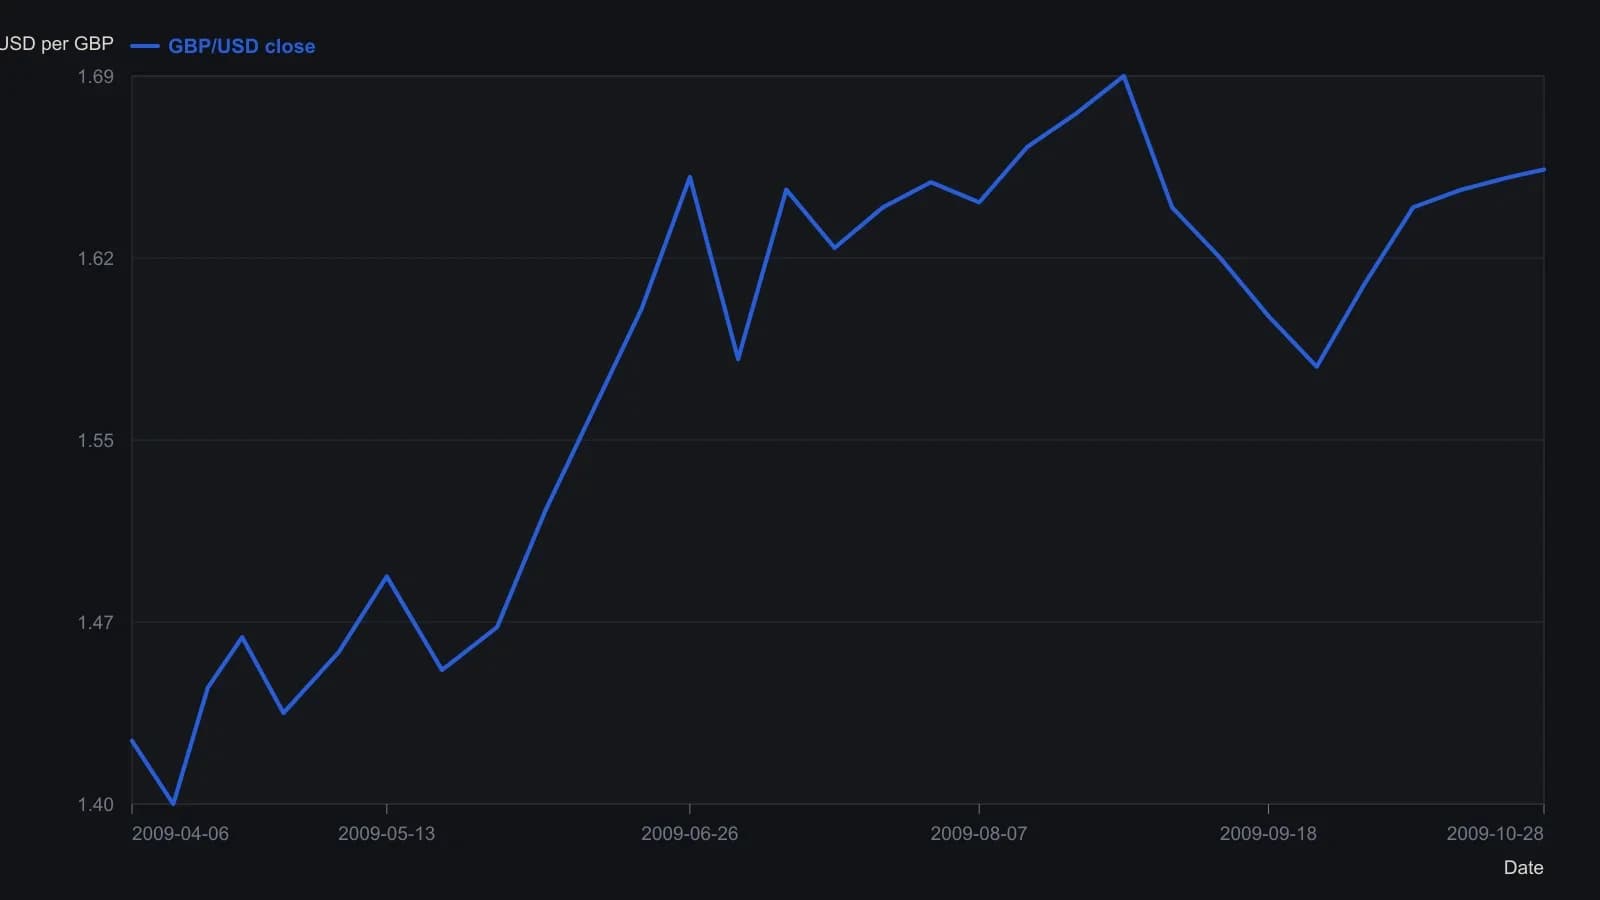
Closes are approximate reads from the unlabeled candlestick raster (NetDania daily, 135 bars on screen). Wicks are omitted. Intermediate dates are spaced along the April 6–October 28 axis; do not treat them as timestamped ticks.