2013issue C0626-30
Constructing an up/down volume oscillator from a web price series
A mechanical Excel workbook can pull a public daily price and volume table, force that table into a split-adjusted sequential history, and write an up/down volume oscillator from the same rules when new bars arrive. Volume-price flags stay attached as constructed signals to test, not as a finished trading plan.
- A VBA workbook can request a public financial page, land the table on a chosen sheet, and immediately reverse, reformat, and recalculate it instead of leaving the series on a browser screen.
- Newest-first downloads need a construction step that places the earliest record at the bottom of a sequential list, then rebuilds open, high, low, and close from the adjusted-close series.
- Initialize fills every derived column across the file; the daily-download step applies the same calculations only to new bars so earlier distribution-day and range notes stay editable.
- The oscillator zeroes two volume accumulators, walks the prior 50 records, and writes 100 times up volume divided by the sum of up and down volume, a reading that stays between 0 and 100.
Landing a public table in a workbook
A VBA workbook can request a public financial page, land the returned table in a chosen sheet, and immediately reverse, reformat, and recalculate that table instead of leaving it on a browser screen.
That sequence is the mechanical trading system in this archive: a button-driven Excel procedure that reformats history, initializes calculation columns, and updates only new bars so the same rules can be rerun without ad-hoc spreadsheet edits.
Date order and split-adjusted prices
Popular site workbooks often arrive newest-first, so a construction step is required to put the earliest record at the bottom of a standard sequential list before later calculations run.
After raw high-low-close and volume columns are pasted, a reformat routine rebuilds open, high, low, and close from the adjusted-close series. That adjusted-close-rebuild leaves the output history split-adjusted back to the first retained record, which is the series later formulas should see.
Display flags leave the series unchanged
A dollar-format flag in a header cell switches price and change columns between an accounting display for stocks and a plain number display for indexes. The flag does not change the underlying series used by later formulas.
Initialize the file, then update only new bars
An initialize routine fills every derived column from a 50-day simple moving average through range-expansion percent change across the whole file. It must be rerun after a full history paste, and after any header setting other than name or symbol is changed.
A daily-download routine applies the same calculations only to newly arrived bars. Previously written distribution-day and range notes stay editable instead of being overwritten with the whole history.
Building the up/down volume oscillator
The up/down volume oscillator is built by zeroing two accumulators, walking the prior 50 records, and assigning each day's volume to the up or down bucket from that day's price change. The routine then writes 100 times up volume divided by the sum of up and down volume.
The result is a 0-to-100 ratio of accumulated up-day volume to the sum of up-day and down-day volume over that fixed lookback of daily bars.
Volume-price columns as testable signals
The same workbook can attach price-volume study columns and O'Neil-style supply-demand and market-direction readings to the cleaned daily series. Volume-price analysis here means reading daily price change together with volume to mark conditions such as distribution days or range expansion as chart hypotheses, not as completed trades. Those columns are constructed signals to test rather than a finished trading plan.
NASDAQ Composite 50-day up/down volume ratio
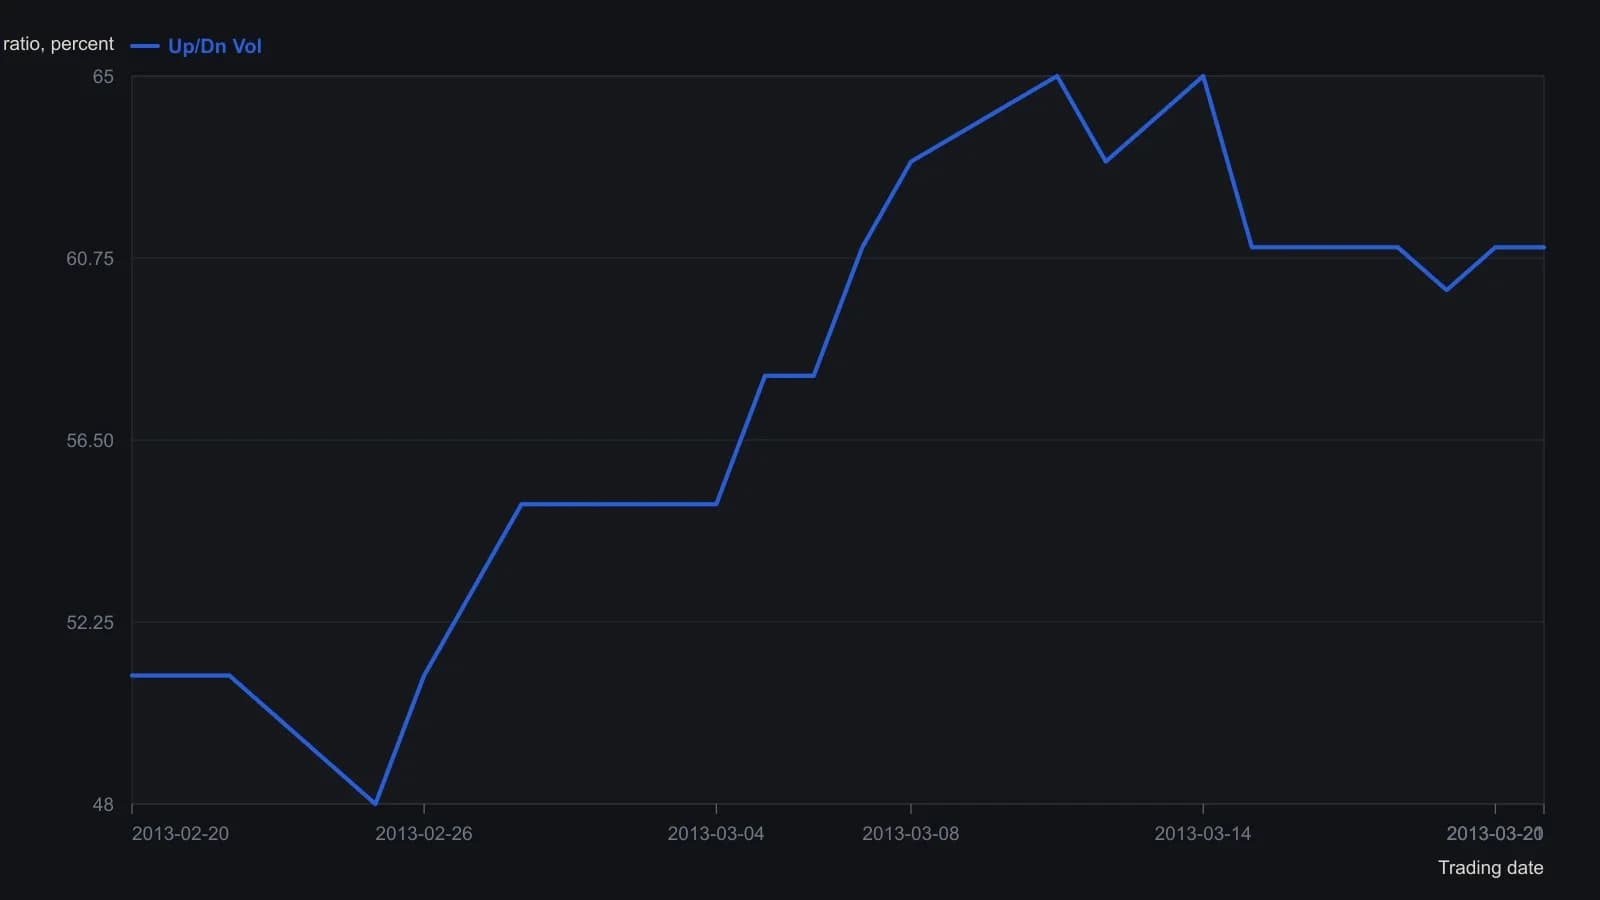
Each bar uses the 50-session lookback set in Volume Moving Avg. A close must move at least 0.02 percent versus the prior close before that day’s volume is counted as up or down; days inside the band are omitted from both totals. The workbook writes the ratio as an integer on a 0–100 scale.
All readings on this track · 6 readings
- 1990Evaluating a weekly up-volume ratio and an hourly oscillator
- 1993Score one swing with volume, bands, and price divergence
- 1993Constructing smoothed stochastics and an up/down volume oscillator
- 2001Constructing volume breadth with a negative volume index and up/down ratios
- 2005Constructing a signed, bounded market-breadth panel
- 2013Constructing an up/down volume oscillator from a web price series