1990issue C021-3
Evaluating a weekly up-volume ratio and an hourly oscillator
Up-versus-down volume is one volume-price premise built two ways: a five-session up-volume ratio and an hourly up/down volume oscillator. Each series is smoothed the same way and graded only by sampling unit, state rule, and forecast horizon.
- Both constructions rest on the same volume-price premise: volume concentrated on advances versus declines is treated as a measure of which side of the tape is showing more participation.
- The weekly up-volume ratio uses volume from the most recent five rising sessions divided by volume from the most recent five declining sessions, then a 33 percent exponential smoother described as comparable to a five-week average.
- The hourly up/down volume oscillator compares average volume on a week’s rising hours with average volume on that week’s declining hours and applies the same smoother.
- A one-standard-deviation state rule did not show the hourly oscillator to be useful for next-week, four-week, or 13-week market direction. The same rule applied to six-month and one-year ahead direction produced chi-squared values of 6.7 and 9.1, with reported odds near 2 to 1.
A shared volume-price premise
Both constructions rest on a volume-price premise. Volume concentrated on advances versus declines is treated as a measure of which side of the tape is showing more participation.
The weekly up-volume ratio
The weekly up-volume ratio is defined as volume from the most recent five rising sessions divided by volume from the most recent five declining sessions.
That daily-window ratio is then passed through a 33 percent exponential smoother, described as comparable to a five-week average. Over a six-year sample the smoothed daily-window ratio had a mean of 106.5 percent and a standard deviation of 7.71.
The hourly up/down volume oscillator
The hourly up/down volume oscillator compares average volume on a week’s rising hours with average volume on that week’s declining hours, then applies the same 33 percent exponential smoother.
Over the same six-year span the hourly oscillator averaged 105.4 percent with a standard deviation of 7.08.
A standard-deviation state rule
One evaluation rule labeled the hourly oscillator one state when it stood more than one standard deviation above its mean and the opposite state when it stood more than one standard deviation below its mean.
Under that rule, tests of next-week, four-week, and 13-week market direction did not show the hourly oscillator to be useful at those short horizons.
The same rule applied to six-month and one-year ahead direction produced chi-squared values of 6.7 and 9.1, with reported odds near 2 to 1.
Weekly five-session up-volume ratio, 1984–1989
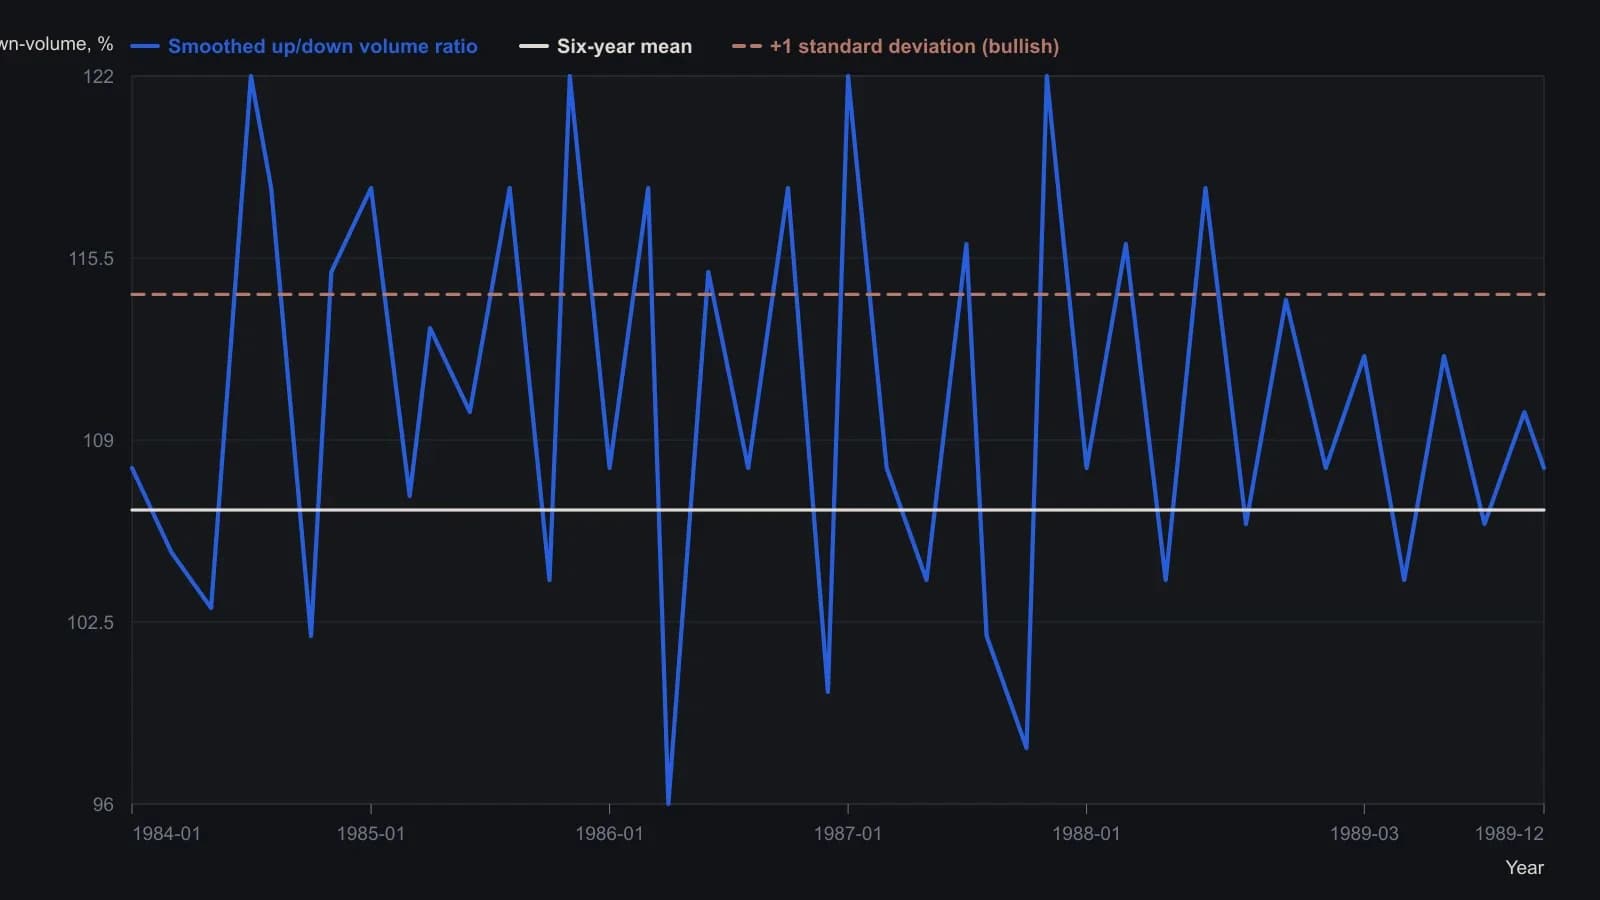
Source used a 33% exponential (about a five-week average). Mean 106.5% and standard deviation 7.71 are stated in the article for the six-year window. Digitizing is approximate; the raster does not support finer precision.
All readings on this track · 6 readings
- 1990Evaluating a weekly up-volume ratio and an hourly oscillator
- 1993Score one swing with volume, bands, and price divergence
- 1993Constructing smoothed stochastics and an up/down volume oscillator
- 2001Constructing volume breadth with a negative volume index and up/down ratios
- 2005Constructing a signed, bounded market-breadth panel
- 2013Constructing an up/down volume oscillator from a web price series