1986issue C081-5
Calendar-locked averaging of price-change histogram categories
Successive price differences are tallied, split into thirds, and recoded as dated category codes. Those codes are then locked to a month-start calendar bin and averaged so a recurring calendar pattern is either visible in the stack or ruled out.
- Successive price differences can be tallied in a price-change histogram, split into thirds, and recoded in date order as the category codes 1, 2, and 3.
- Trigger alignment places the first trading day of each month in the first calendar bin and writes later category codes into later bins.
- The averaging-histogram value in a bin is the sum of the codes entered there divided by the count of those entries, and more months are described as making that average more accurate.
- After monthly stacking, the soybean-meal daily-change averages showed no discernible pattern, so the same construction is proposed on a crop-year monthly basis.
Build dated category codes first
Successive price differences can be tallied in a price-change histogram, split into thirds, and recoded in date order as the integers 1, 2, and 3. Each category code places that change into one part of the histogram and keeps the date attached.
In the soybean-meal illustration those three codes corresponded to change intervals of -10.00 to -1.20, -1.10 to +1.80, and +1.90 to +10.00. The illustrated series used soybean-meal closing prices from April 1980 through April 1981.
Lock each month to the first calendar bin
A month-start construction places the first trading day of each month in bin 1, writes the following category codes into later bins, and repeats that trigger alignment for every later month in the sample.
A trading-day-only month uses 23 calendar bins. A calendar layout can use 31 bins and leave weekend and holiday bins empty. Each calendar bin is a numbered slot for a trading day or a calendar day, including those empty slots.
Average the aligned stack
The averaging histogram is the stack of aligned category codes. The averaged category in a bin is the sum of the codes entered there divided by the count of those entries, and more months are described as making that average more accurate.
The same stacking procedure can be applied to raw prices, price changes, or categories of either. After monthly stacking, the soybean-meal daily-change averages showed no discernible pattern.
Calendar-bin average of soybean-meal price-change categories
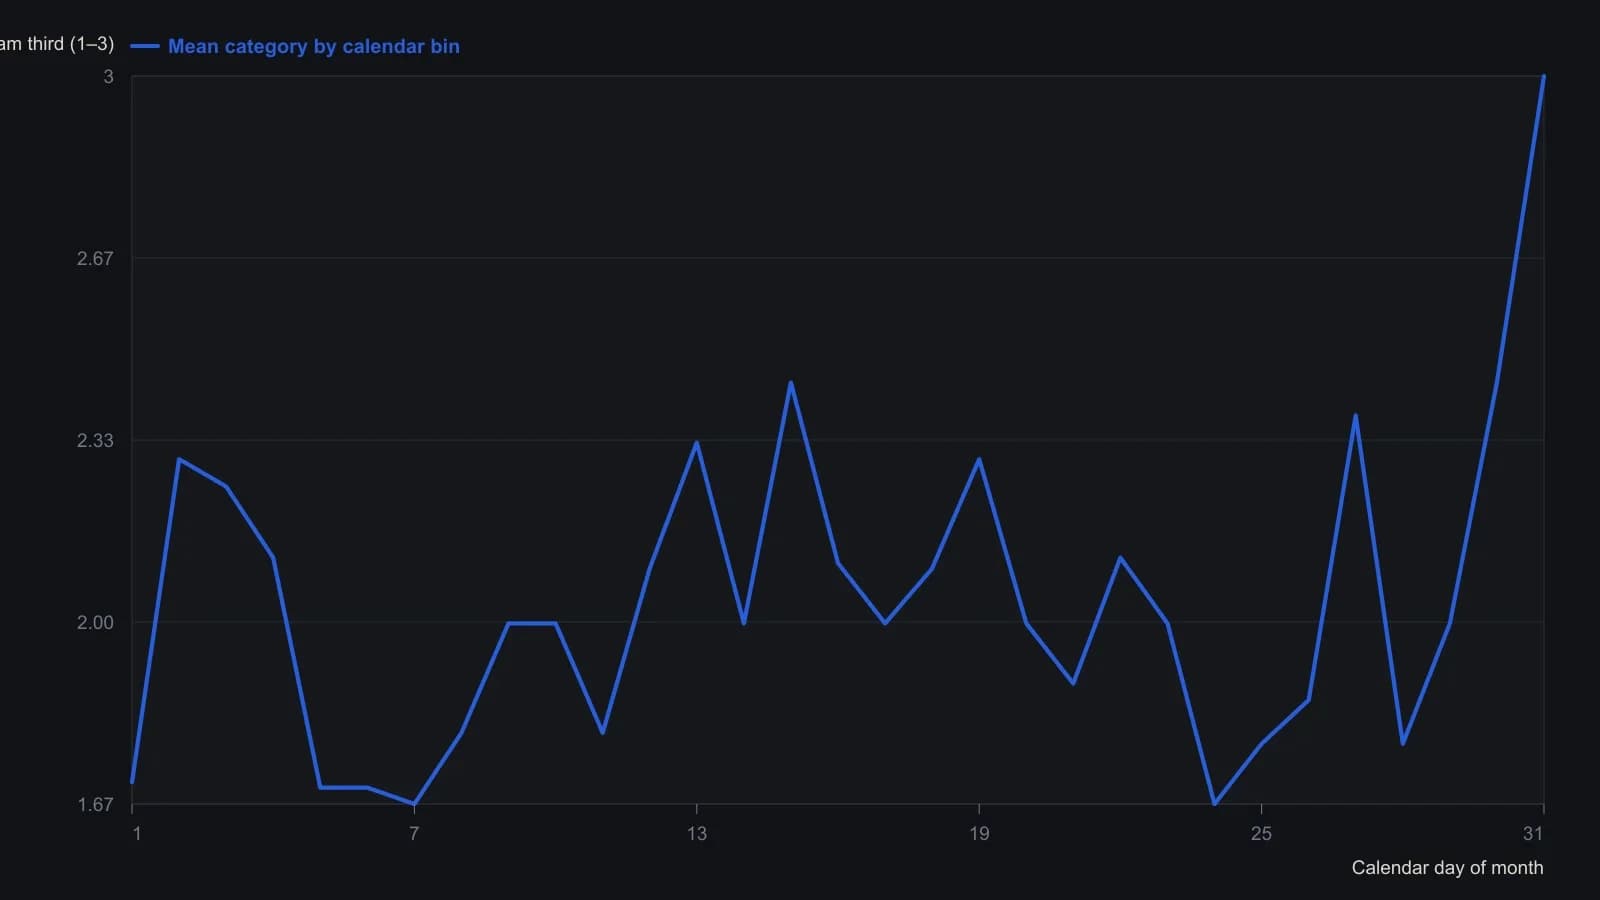
Category 1 is a change of −10.00 to −1.20, 2 is −1.10 to +1.80, and 3 is +1.90 to +10.00. Empty cells are non-trading days and are omitted from each bin’s count, not treated as zero. Averages are unweighted means of the codes actually entered in that bin.
Check crop years and refresh the bins
The same construction is proposed on a crop-year monthly basis as the check for whether a seasonal pattern would appear in the sector averages. That seasonal analysis repeats the same alignment over months or crop years to test whether a recurring calendar pattern remains after averaging.
Keeping a running sum in each bin allows the average histogram to be refreshed as new daily or weekly observations arrive.
All readings on this track · 7 readings
- 1986Constructing price-change density histograms and symmetry tests
- 1986Calendar-locked averaging of price-change histogram categories
- 1986Chi-square test for clustered price-change histograms
- 1988Empirical price-change counts versus borrowed statistics
- 1991Constructing tick engines to match price-change histograms
- 1996Constructing a price occupancy histogram and a smoothed mobility reading
- 2003Treat an opening gap as a completed session event