1996issue C021-2
Constructing a price occupancy histogram and a smoothed mobility reading
A two-stage quantitative build first constructs an auditable price-change histogram from the lookback high-low range, then converts the close-versus-peak occupancy gap into a signed mobility reading before exponential smoothing is applied.
- A price-change histogram splits the lookback high-low range into equal-width intervals and allocates each bar by the fraction of its own high-low span that overlaps an interval.
- Bin height can be recovered from cumulative occupancy at interval bounds, or computed interval by interval as the lookback-average fraction of each bar that sits inside the interval.
- The mobility reading is a signed 100-scale comparison of occupancy at the latest close with occupancy in the densest interval.
- Exponential smoothing is applied only after the raw mobility series exists, seeded with the first mobility value and updated with a one-parameter weight.
Two stages in the build
The archive workflow is a two-stage quantitative build. First a price-change histogram is constructed from the lookback high-low range, equal-width intervals, and fractional bar allocation.
The second stage maps the latest close onto that histogram, converts the close-versus-peak occupancy gap into a signed mobility reading, and only then applies exponential smoothing to the mobility series.
Equal-width occupancy of the lookback range
A price-change histogram is constructed by taking the lookback maximum high and minimum low, then splitting that range into a chosen number of equal-width intervals.
The histogram is equal-width occupancy of the lookback high-low range, with each bar contributing the fraction of its own high-low span that overlaps an interval.
Recovering bin height from cumulative occupancy
Bin height is recovered from that allocation by treating the first interval as the cumulative share at its upper bound and each later interval as the change between neighboring cumulative shares.
Cumulative occupancy is the running share of the lookback sample allocated at or below an interval boundary before neighboring shares are differenced into bin heights.
Occupancy computed interval by interval
The same occupancy can be computed interval by interval by adding the fraction of each bar below the upper bound, subtracting the fraction below the lower bound, and dividing by the lookback count.
OEX occupancy histogram over the 14-session high-low range
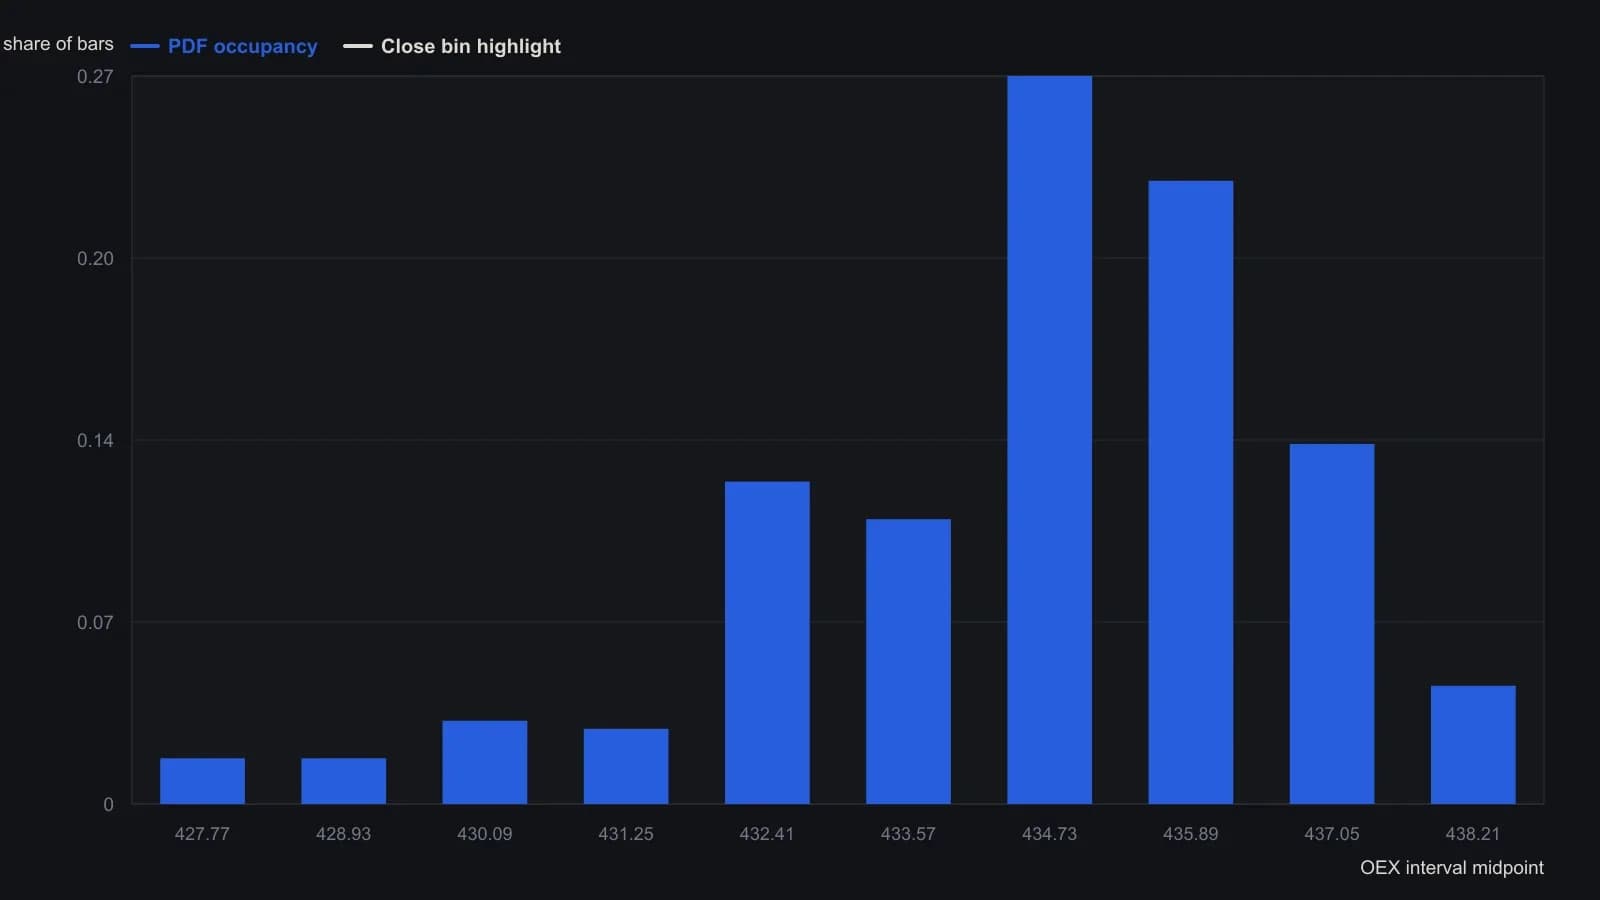
Fourteen daily OEX bars split into ten equal-width intervals from the lookback minimum low to maximum high. A bar that spans more than one interval is allocated fractionally. The LAST row marks only the bin that holds the latest close.
Mapping the latest close
The latest close is mapped onto the histogram by retaining occupancy only in the unique interval whose bounds contain that close.
Forming the mobility reading
The mobility reading equals 100 times one minus the ratio of occupancy at the latest close to occupancy in the densest interval.
That mobility reading is a signed 100-scale comparison of occupancy at the latest close with occupancy in the densest interval.
Sign from the densest-interval midpoint
The reading is left positive when the latest close is above the densest-interval midpoint and negated when the close is below it.
The densest-interval midpoint is the center price of the interval with the largest occupancy; it supplies the sign of the mobility reading.
Smoothing after the raw series exists
Exponential smoothing of the mobility series is seeded with the first mobility value and then updated as the prior smooth plus a weight times the new residual, where the weight is 2 divided by one plus the chosen period.
In this construction, exponential smoothing is a one-parameter recursive average of the mobility series, seeded with the first mobility value and updated with weight two divided by one plus the chosen span.
All readings on this track · 7 readings
- 1986Constructing price-change density histograms and symmetry tests
- 1986Calendar-locked averaging of price-change histogram categories
- 1986Chi-square test for clustered price-change histograms
- 1988Empirical price-change counts versus borrowed statistics
- 1991Constructing tick engines to match price-change histograms
- 1996Constructing a price occupancy histogram and a smoothed mobility reading
- 2003Treat an opening gap as a completed session event