2014issue C1126-31
Confirming swing breakouts after wide-range cups and gaps
The archive workflow waits for the session after a high-volume wide-range day and enters only above that candle's high on an already rising 90-day chart. Cups, in-trend gaps, and 50-day hammers use the same delayed clear.
- Entering solely on a first new-high breakout is described as a common path into later consolidation or pullback.
- A wide-range day at the right edge of a bullish cup is acted on only the next session, and only above that candle's high on a 90-day chart already in an uptrend.
- An in-trend gap is a continuation candidate after later sessions make new highs; three shrinking candles and lighter volume then tighten the trailing stop.
- Hammer pivots are preferred on the 50-day simple moving average, with the trigger above the hammer high rather than at the 100-day or 200-day average.
A first new high is not the whole trade
The archive describes entering solely on a new-high breakout as a common path into later consolidation or pullback. The breakout system is one procedure: it states when to enter above a signal high, when to stand aside during rest or unconfirmed gaps, and when to tighten an exit so a first new-high print is never the whole trade.
The procedure pairs wide-range candlestick breakouts with cup structure, expanding daily ranges, and gap-continuation rules. MACD, RSI, and stochastic crossovers are treated as lagging sources of false entries.
Wide-range cups wait for the next session
A wide-range candle is a daily candle whose height is at least twice the height of each of the prior two daily candles. That print is used when it appears at the right edge of a bullish cup, a rounded base whose right-edge high is the reference for a later breakout entry.
The entry plan waits until the session after a high-volume wide-range day and buys only above that candle's high. The 90-day chart must already be in an uptrend. Candlestick patterns such as wide-range days and bullish cups turn that repeatable chart condition into a falsifiable swing hypothesis.
Expanding and shrinking ranges
Three successive taller daily candles are read as range expansion that can continue a breakout. Three successive shorter daily candles are read as exhaustion or consolidation risk. After a gap continuation is already in profit, three shrinking candles plus lighter volume are the cue to tighten a trailing stop.
The volatility-breakout test is read from candle height rather than from a derived oscillator. Expanding daily ranges and high-volume gap days support continuation; shrinking ranges warn that momentum is fading.
Gaps confirm after later highs
An in-trend gap is treated as a continuation candidate when the gap day is a high-volume wide-range candle and price makes new highs in the following two to three sessions. The gap session itself is not the swing entry.
Weak gaps that reverse are described as often pausing near a 50% retracement. A later add is used only after new 15-day highs clear the gap high.
US Steel daily closes around the late-July 2014 continuation gap
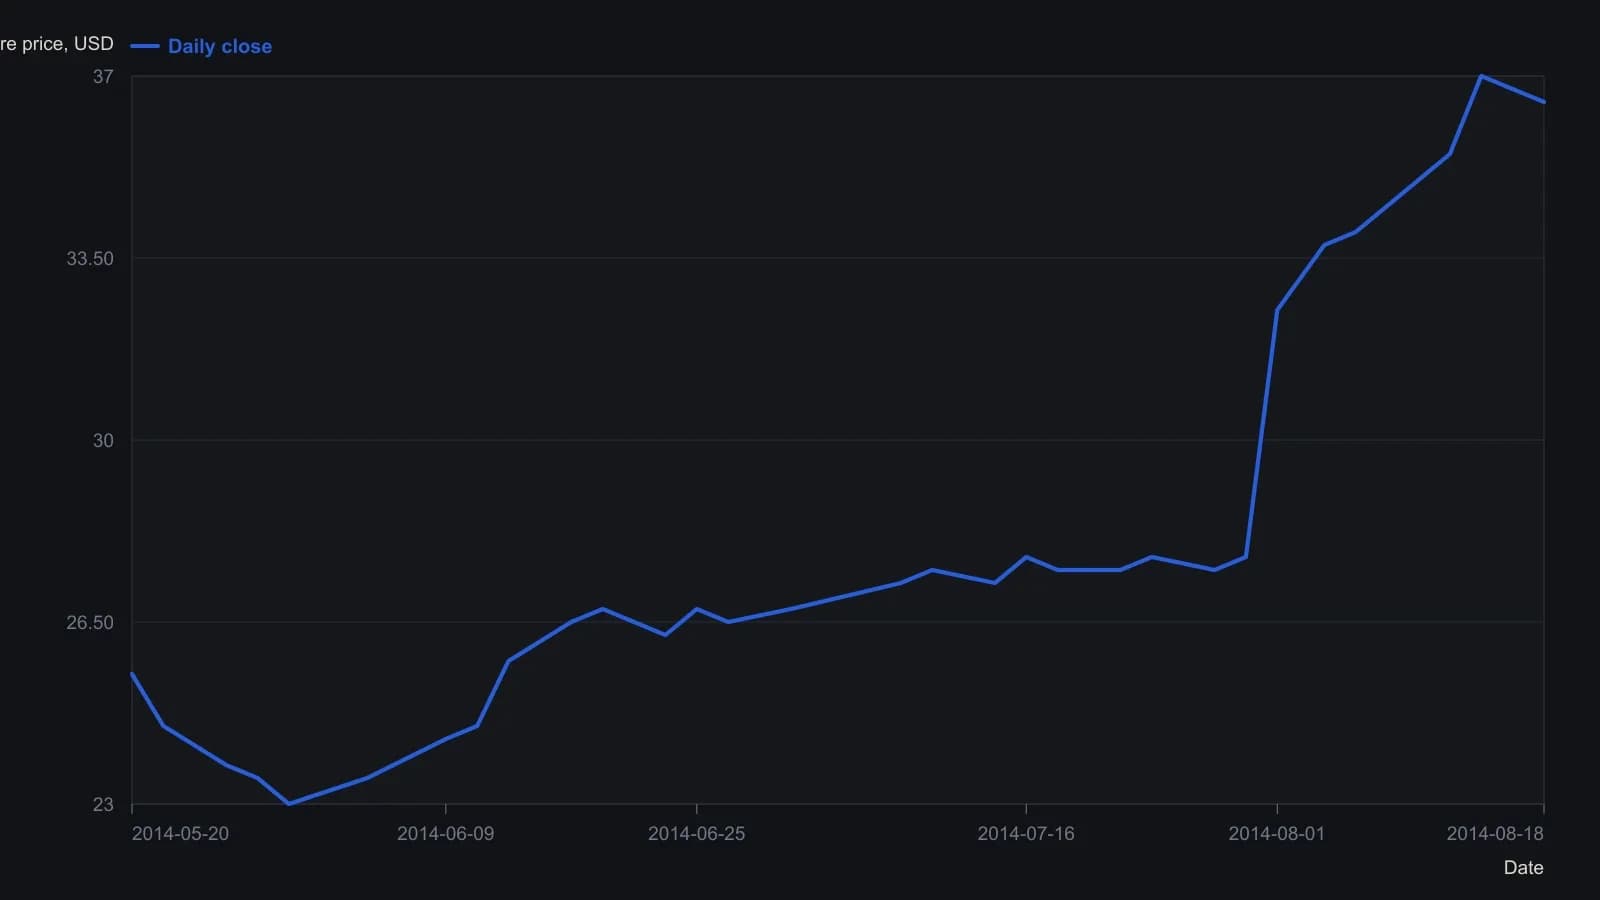
Daily closes are approximate and rounded to the nearest 0.25 because the raster scale is marked every 0.50. The last pre-gap close is the candle sitting just under 28; the first print after the window is aligned with the article’s stated 32 gap.
Hammers on the 50-day average
Hammer candles resting on the 50-day simple moving average are preferred over hammers at the 100-day or 200-day average as long-side pivot entries. The trigger is above the hammer high, matching the later-clear rule used at cups and gaps.
How the swing is scanned
The swing horizon is several days to several weeks. Trades in this framework are scanned on 90-day daily candles plus 15-day, 15-minute candles.
All readings on this track · 11 readings
- 1995A tight-range volatility breakout as one classroom procedure
- 1995Constructing range-compression breakout procedures
- 1996Volatility contraction and narrow-range breakout rules
- 1998Gold volatility breakout as one written entry and exit procedure
- 2005Evaluating next-day range expansion breakouts
- 2006Combining BandWidth extremes with a Stochastic oscillator and a Volatility breakout
- 2007Gating currency volatility breakouts with ADX and trailing stops
- 2010Closing half-hour longs after late bear rallies
- 2013Bollinger Bands, volatility breakout, and breakout confirmation as one testable procedure
- 2014Confirming swing breakouts after wide-range cups and gaps
- 2019Extreme-seeking volatility with bands, breakouts, and chandelier exits