2013issue C1249-52
Bollinger Bands, volatility breakout, and breakout confirmation as one testable procedure
The historical workflow already placed Bollinger Bands beside screening, pattern search, and an expert overlay. This archive article locks the sampling interval, lookback, and holding period so a quantitative baseline can be checked against an out-of-sample result, and so entry, exit, and abstention stay one falsifiable procedure.
- Bollinger Bands sit with screening, pattern search, and an expert overlay so a band forecast can be checked against later price, volume, or breadth observations on a defined sampling interval and lookback.
- Volatility breakout is listed with trend-following, reversals, and confirmed breakout, which lets those rules be searched as one procedure rather than separate discretionary glances.
- Screens, an explicit lookback script, and Bollinger Bars keep the universe and the open-high-low-close structure repeatable before a band, volatility, or breakout filter is applied.
- Named overlays such as Ice Breaker, a chandelier stop, and Alphier Expectation follow the quantitative baseline. An abstention rule is the condition under which the combined procedure stays flat.
One workflow, three checks
The reviewed site presents Bollinger Bands together with screening, pattern search, and an expert overlay. A band forecast can then be checked against later price, volume, or breadth observations on a defined sampling interval and lookback.
Method lists on the site group volatility breakout with trend-following, reversals, and confirmed breakout. Those rules can be treated as one searchable procedure rather than separate discretionary glances.
Boeing price and 20-period Bollinger Bands, 2013
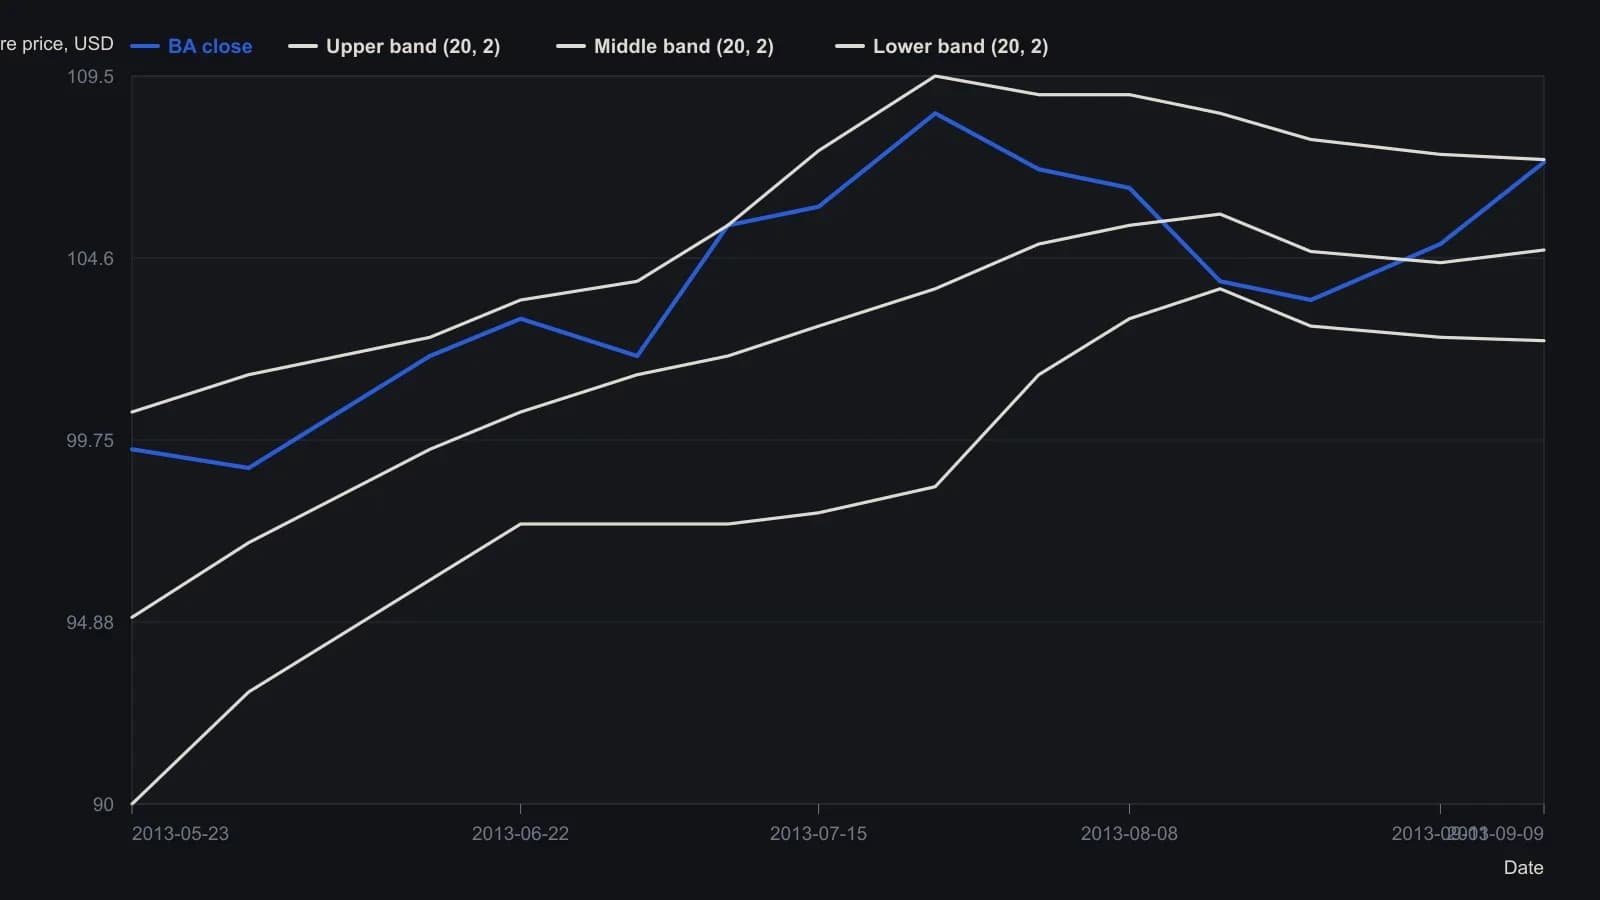
The site fixed the envelope at 20 periods and 2 standard deviations for 23 May–9 September 2013. Digitized levels are only good to about half a dollar; do not treat them as official prints except on 9 September.
Lock the universe before the filter
Screens can restrict the universe by sector or group and then by price range, percent or dollar change, average or normalized volume, and market cap. Only after that cut is a band, volatility, or breakout filter applied.
A supplied script example, written in a formula language for repeatable indicator and filter calculations, computes rate of change from the difference between the latest close and the close 12 observations earlier, divides by the latest close, scales by 100, and plots the series. The lookback stays explicit.
Repeatable structure for breakout confirmation
Bollinger Bars color an all-green bar when the open is the low and the close is the high, and an all-red bar when the open is the high and the close is the low. Other bars keep blue wicks. That coloring gives a repeatable open-high-low-close structure for breakout confirmation.
Overlays sit after the baseline
A sample expert text for one name on one date reports a prior Bollinger Band and RSI sell, a same-day Ice Breaker sell, a suggested chandelier stop above that day's high, and an overbought Alphier Expectation reading.
Editorial reading: Ice Breaker is a sell-side confirmation that can start a stop above a stated high. The chandelier stop is a trailing exit referenced from an extreme after a sell or breakout signal. Alphier Expectation is only a state filter, not a standalone forecast. None of those overlays replaces the quantitative baseline. The abstention rule is the explicit condition under which the combined procedure stays flat instead of taking a trade.
What the site keeps proprietary
Four navigation arrows move a chart to the industry group, the next strongest name, the next weakest name, or the next name in the group. Strongest and weakest are defined by a weighted momentum calculation over three periods.
The site is described as having only three proprietary areas: PowerShifts, Alphier methods such as Expectations, and the strongest-versus-weakest navigation math. PowerShifts is a list-building method grouped with other method screens. Other calculations are presented as fully disclosed.
How to keep the procedure falsifiable
Editorial reading: reuse the same sampling interval, lookback, and holding period for the band forecast, the volatility-breakout signal, and the breakout-confirmation overlay. Check that quantitative baseline against an out-of-sample result. Entry, exit, and abstention then stay testable as one procedure rather than three separate glances.
All readings on this track · 11 readings
- 1995A tight-range volatility breakout as one classroom procedure
- 1995Constructing range-compression breakout procedures
- 1996Volatility contraction and narrow-range breakout rules
- 1998Gold volatility breakout as one written entry and exit procedure
- 2005Evaluating next-day range expansion breakouts
- 2006Combining BandWidth extremes with a Stochastic oscillator and a Volatility breakout
- 2007Gating currency volatility breakouts with ADX and trailing stops
- 2010Closing half-hour longs after late bear rallies
- 2013Bollinger Bands, volatility breakout, and breakout confirmation as one testable procedure
- 2014Confirming swing breakouts after wide-range cups and gaps
- 2019Extreme-seeking volatility with bands, breakouts, and chandelier exits