1995issue C021-10
Collapse correlated inputs via a joint-state chi-square sequence
A multi-input forecast can spend capacity on two series that mainly record whether they agree. This archive construction puts both series on one scale, maps them onto a shared quarter grid, tests that grid against independence, and keeps a single difference-score feature.
- If two forecast inputs were perfectly correlated, removing one would leave model efficiency unchanged.
- When the overlap is imperfect and dropping one input reduces efficiency, the model may be using whether the two series agree or disagree.
- Z-score scaling and quartile encoding turn the pair into a transition matrix of difference scores, which a chi-square test compares with an independence baseline.
- If replacing the pair with that single series leaves efficiency unchanged, an additional uncorrelated input can be added without extra computational effort.
When two inputs overlap
A multi-input forecast model can contain cross-correlated series. If two inputs were perfectly correlated, removing one would leave model efficiency unchanged.
When the correlation is imperfect and removing one input reduces efficiency, the model may be responding to whether the two series agree or disagree. That case motivates replacing the pair with one series that encodes the interrelationship.
Correlation analysis is a check for whether two model inputs carry overlapping information, including the case where the model is using their agreement or disagreement rather than either series alone.
Put both series on one scale
A worked construction used 11 monthly component series from 1948 through 1992, yielding 540 observations each, then converted every series to z-scores because the raw scales differed.
A z-score is a dimensionless rescaling that subtracts a series mean and divides by its standard deviation so differently scaled inputs can be compared. After that conversion each series has mean 0 and standard deviation 1, retains the original variability on a dimensionless scale, and in this setup 99 percent of z-scores lie between -3 and +3.
Z-score CDFs of manufacturers' unfilled orders and building permits
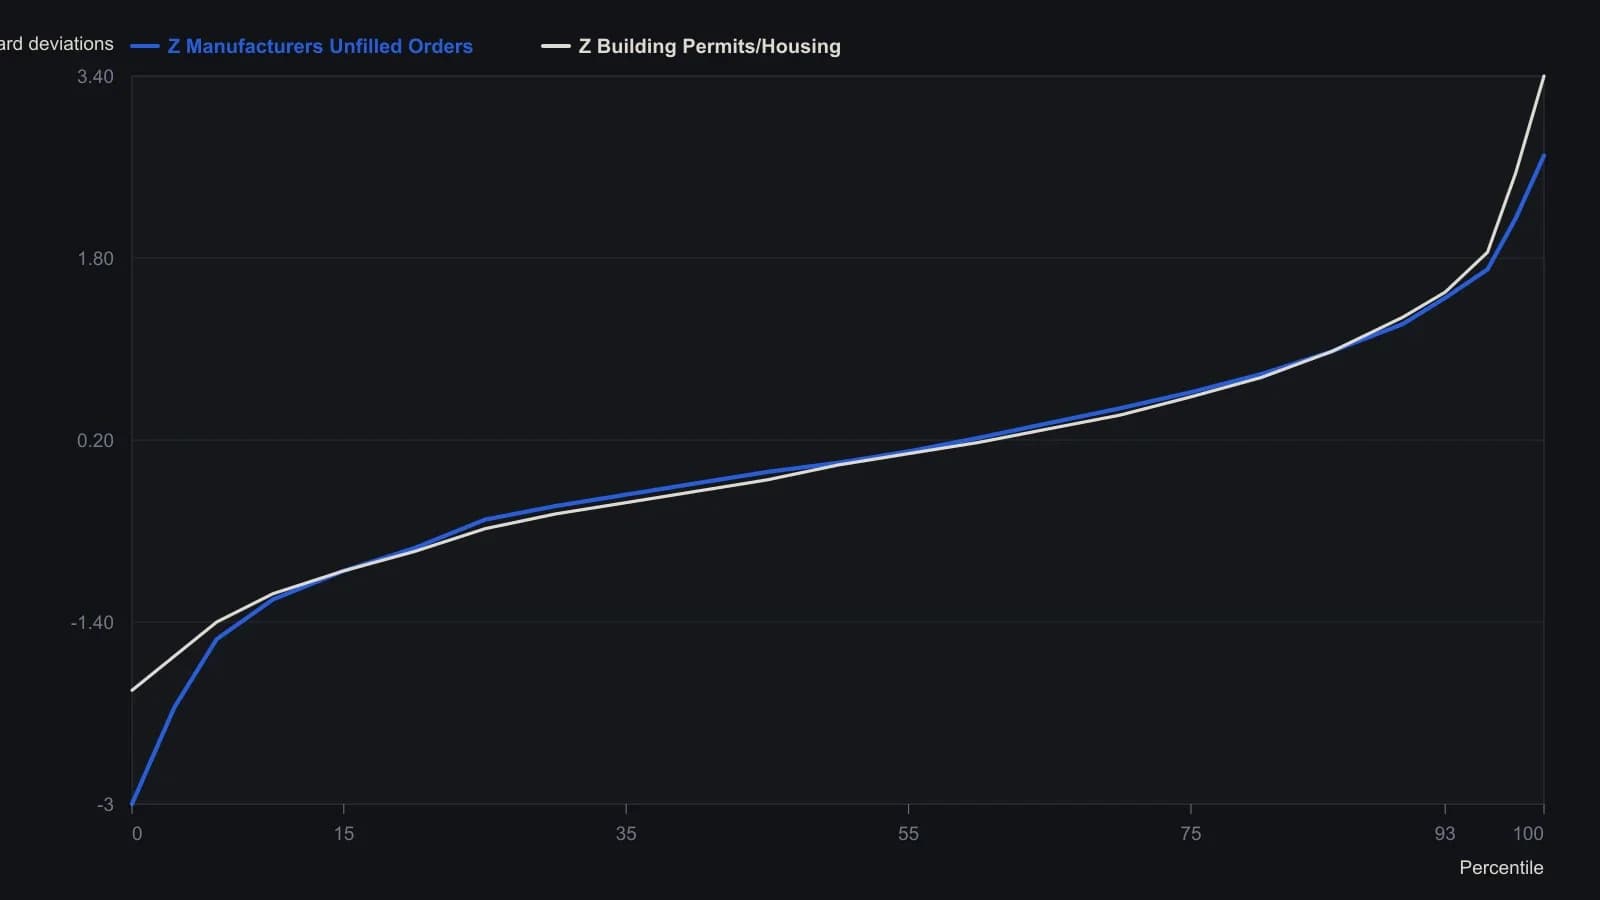
Monthly CI components, 1948–1992 (540 observations), converted to z scores before ranking. Digitized from the plotted curves; mid-sample points are approximate.
Map the pair onto a shared state grid
Several component pairs have similarly shaped cumulative probability density functions, so the next step compares discrete distributional states rather than raw levels.
Quartile encoding replaces each observation by an integer 1 through 4 according to which quarter of its cumulative distribution it occupies. Each cumulative distribution is split into four approximately equal quarters and every observation is replaced by a category symbol 1, 2, 3, or 4.
The transition matrix is the table of paired quarter-states formed by lining up two encoded series, then collapsing those cells into one sequence of difference scores. Pairing those symbols produces a discrete joint-state table that collapses to difference scores from -3 to +3.
A difference score is the integer obtained by subtracting one series quarter label from the other, ranging from -3 to +3. A score of -3 occurs only for the 1-versus-4 pairing, and a score of 0 occurs when both series occupy the same quarter.
Test the grid against independence
If the two discretized series were independent, each of the seven difference scores would be expected about 77 times in 540 observations. A chi-square test compares observed joint-state frequencies with the counts expected if two discretized series were independently distributed.
In the worked pair, both series had the same difference score 31 percent of the time, and the chi-square comparison indicated they were not independently distributed.
Keep one agreement feature
The original pair can be replaced by the difference-score series or by a recoded series derived from those scores, after which model efficiency is rechecked. If efficiency is unchanged, an additional uncorrelated input can be added without extra computational effort.
All readings on this track · 6 readings
- 1985A serial-dependence window from signed price transitions
- 1986Chi-square tests on price transition matrices
- 1987Evaluating money-supply serial dependence before a forecast
- 1988Evaluating stationarity, randomness, and dependence in an index series
- 1993Constructing price-change Markov transition matrices
- 1995Collapse correlated inputs via a joint-state chi-square sequence