2019issue C0350-58
Breakaway gap after a completed double bottom
The historical close identifies the piece as a breakaway-gap case continued from an earlier page of the same issue. This editorial reading keeps a later unfilled gap as a continuation hypothesis only after a completed double-bottom or double-top, and drops the idea on gap fill or pattern failure.
- A later unfilled gap is a continuation hypothesis only after a completed double-bottom or double-top is already on the chart.
- Gap fill or failure of that reversal structure is the later event that kills the idea.
- The historical close presents trading breakaway gaps as the subject of the case study, not as general market commentary.
- Related reading in the close points to a prior double-bottoms study in the same reversal-pattern family.
What the archive piece is
The close of the historical piece identifies it as a breakaway-gap case continued from an earlier page of the same issue.
The close treats trading breakaway gaps as the subject of the case study, not as general market commentary.
The author presents the work as market-chart research that applies mathematical-modeling methods to price structure.
The reversal structure comes first
A double-top-bottom is a two-peak or two-trough reversal structure. Here it is the precondition that makes a later gap interpretable.
A breakaway-gap is a gap that appears after a completed reversal structure and is read as a possible start of a new directional move until later bars invalidate it.
EUR/USD daily 200-tick zigzag, 2018–2019
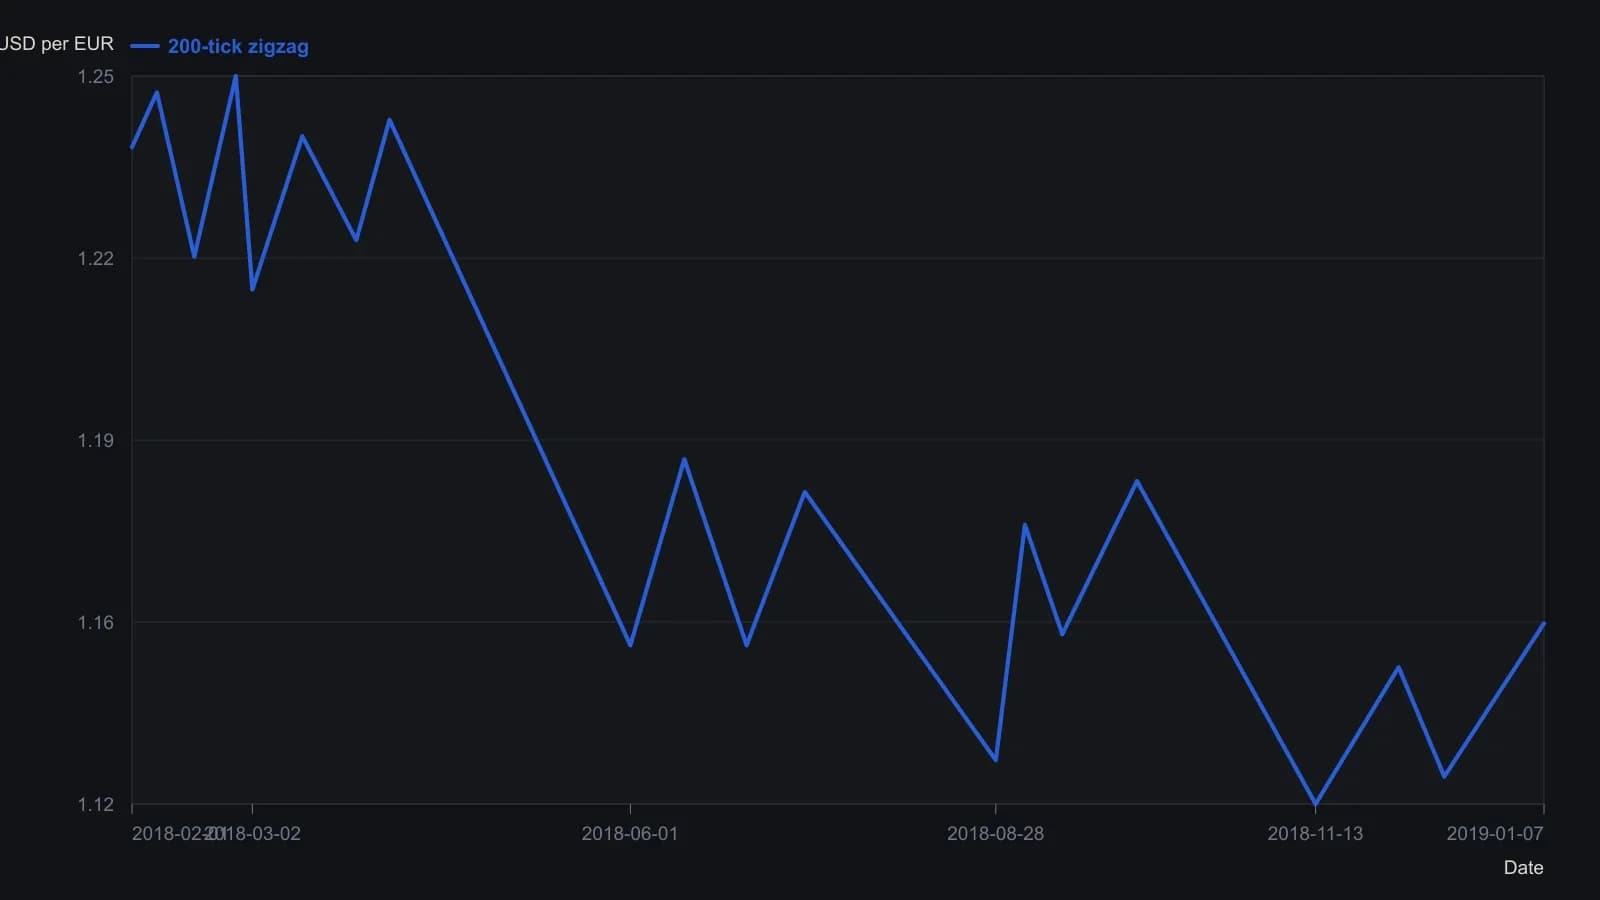
The overlay is SveHLZigZagTicks on High/Low/Close with 200 ticks and 0.0001 tick size, so a turn needs about 200 pips. Calendar dates of the turns are interpolated from the monthly axis and are approximate. The last rising leg into January 2019 is the unconfirmed current swing.
How the gap is checked
Gap-analysis means checking the empty price range, later closes, and whether that range fills in order to keep or drop the continuation hypothesis.
A gap-fill is a return of price into the empty range created by the gap. It is used as a clear invalidation of the continuation hypothesis.
Written this way, the chart condition is a falsifiable-setup: a repeatable OHLC condition written so that a later price event can accept or reject it.
Related reading and author context
Related reading in the close points to a prior double-bottoms study, linking the gap case to that reversal-pattern family.
The author bio states that the writer founded a venue for backtesting various strategies.
Editorial note: that line is biographical. It does not report a test of this chart case.
All readings on this track · 7 readings
- 1991The midpoint retest after a missed breakaway gap
- 2011Constructing volume-confirmed breakaway gaps
- 2011The first close after a breakaway gap as a classroom breakout test
- 2011Constructing candlestick, breakaway-gap, and Elliott-wave signals
- 2013A PHM breakaway gap stacked with Elliott labels and mapped support
- 2019Breakaway gap after a completed double bottom
- 2019Evaluating upward breakaway gaps by changing one rule at a time