1987issue C081-3
Constructing price gap classifications from follow-through
A gap is the untraded interval created when successive price ranges do not overlap. Classification is constructed from recent trade, the edge of a congestion area, and whether later sessions follow through, labor, or reverse.
- A gap is the untraded interval on a chart created when successive price ranges do not overlap.
- A common gap is constructed when the skipped prices already traded in the recent past and is treated as having no special implication.
- A breakaway gap is read as the start of a rapid move only when later sessions follow through; an exhaustion gap is difficult to classify except from the action that follows it.
- A congestion area held for a few weeks or longer later acts as support from above or resistance from below, with that effect related to duration and volume.
What the blank interval is
A gap is the untraded interval on a chart created when successive price ranges do not overlap. Gap analysis classifies that blank interval from its place in prior price structure and from the sessions that follow it.
Editorial interpretation: treat the reading as a construction sequence. Ask whether the skipped prices already traded in the recent past, whether the hole sits at the edge of a congestion area, and whether the next sessions follow through, labor, or reverse. Each gap type is then a checkable hypothesis rather than a label applied after the move is over.
Start with recent trade and the range edge
A common gap is constructed when the skipped prices already traded in the recent past and is treated as having no special implication.
A breakaway gap is constructed at a breakout from congestion or consolidation and is read as the start of a rapid move when later sessions follow through in the breakout direction.
Editorial interpretation: if the skipped prices already traded recently, construct a common gap and assign no special implication. If the hole sits at the edge of a congestion area or consolidation, hold a breakaway hypothesis and wait for later sessions before treating the hole as the start of a rapid move.
Read follow-through, labor, or reverse
A runaway gap is identified after a breakout is already underway and is treated as a strong-trend marker when it appears with high volume or a limit session. That identification assumes the breakout is already in force, so the new hole is not the opening of the move.
An exhaustion gap is defined as the last-stage hole of a move and is difficult to classify except from the action that follows it. After a gap opening, labored and unsuccessful short-term rally attempts support classifying the hole as exhaustion and watching for a reversal structure.
Editorial interpretation: follow-through in the breakout direction keeps a breakaway or runaway reading in force. Labored and unsuccessful short-term rally attempts support an exhaustion reading. A reverse after the hole is what makes the last-stage classification usable, because the opening alone does not settle it.
Use the congestion area as the reference
A congestion area is a range traded for a few weeks or longer. Approached from above it acts as support and from below as resistance, with that effect related to its duration and volume. Inside a congestion area opposing positions accumulate in balance. A later return to that range lets trapped range traders exit and lets traders who missed the break enter in the breakout direction at a previously workable level.
Editorial interpretation: the congestion area is the reference for the edge check. Duration and volume belong to how that range later acts as support or resistance. A later return to the range is a separate event that offers a previously workable level. It does not rename the original hole after the fact.
June 1986 Deutsche Mark futures with labeled gap types
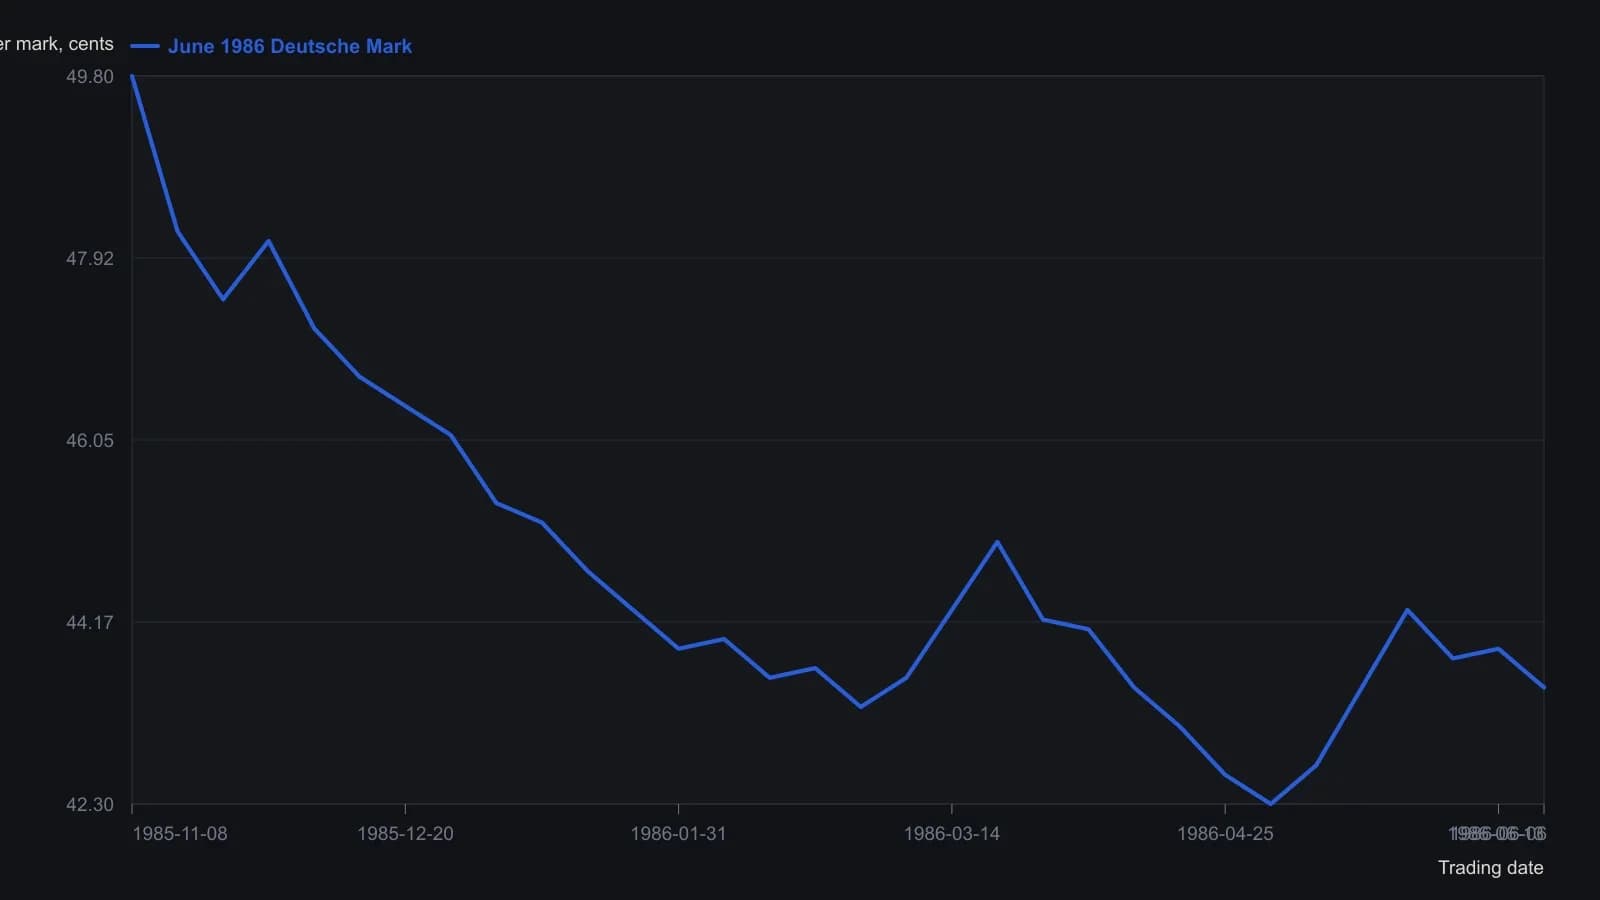
Weekly visual readings from a daily-bar raster. The printed scale is labeled in whole numbers, so values are given to one tenth of a cent and are estimates, not exchange ticks. Dates follow the month headers on the chart, not a session calendar.
All readings on this track · 6 readings
- 1987Constructing price gap classifications from follow-through
- 1990Breakaway versus exhaustion: classify the skip from both sides
- 1990Constructing gap signals from skipped price zones
- 2004Constructing gap classifications from price context
- 2015Exhaustion gap entry, hold, and exit rules as one procedure
- 2016Four gap types as falsifiable trade hypotheses