2004issue C121-2
Constructing gap classifications from price context
A gap starts as an untraded price band, not as a finished name. Mark that empty interval and the consolidation or trend that encloses it, then treat breakaway and exhaustion as competing labels that later price action can confirm or kill.
- A gap is a price band where no shares changed hands when it formed, so construction starts by marking that unused interval.
- On a daily chart, an upside gap is one session's low sitting above the prior session's high, which still leaves the type unassigned.
- Type is read from the enclosing consolidation or trend, which is why a common-gap stays inside a range while a breakaway-gap marks prices leaving it.
- An exhaustion-gap and a continuation-gap are often hard to separate by location alone, so they remain competing labels until later action shows ending momentum or more travel.
Mark the untraded band first
A gap is a price range where, at the moment it formed, no shares changed hands. The unused band is the construction unit. It is not yet a type.
On a daily chart, an upside gap occurs when one session's low sits above the prior session's high. That daily-upside-gap defines the empty interval between those prints. It does not classify the event.
Let surrounding structure assign the type
Gap type is assigned from surrounding structure more than from the empty print. The consolidation or trend that encloses the hole is the gap-context.
Common, area, or pattern gaps appear inside consolidations, often near bounding support or resistance. They are treated as local reactions. Their main construction use is to flag that a congestion area is being built.
An island reversal is a paired opposite-gap set that isolates a small congestion pocket. The reading comes from that paired structure and the pocket it cuts off, not from either empty print alone.
A breakaway marks prices leaving the range
Breakaway gaps also form in or near consolidations, but they mark prices leaving that range rather than remaining inside it. The same neighborhood that can host a common-gap can host a breakaway-gap. The difference is whether prices stay in the congestion or leave it.
A breakaway gap can stay open for weeks, months, or sometimes years. A longer preceding range is associated with a longer following trend.
Hold continuation and exhaustion until later action
Continuation or runaway gaps appear during a forceful trend. They are described as often forming near the height of the move, commonly around the halfway point between the originating breakout and the later reversal day or congestion that ends it.
Exhaustion gaps are easiest to recognize after the fact and mark ending momentum rather than more trend to come. They are not always immediately separable from continuation gaps by location alone.
Gap-analysis uses the print and its context
Gap-analysis is the practice of turning a repeatable empty-print condition, plus the structure around it, into a hypothesis that later price action can confirm or kill. The label is built from the unused band and the gap-context, then tested by what price does next.
September 2004 frozen orange juice runaway gaps
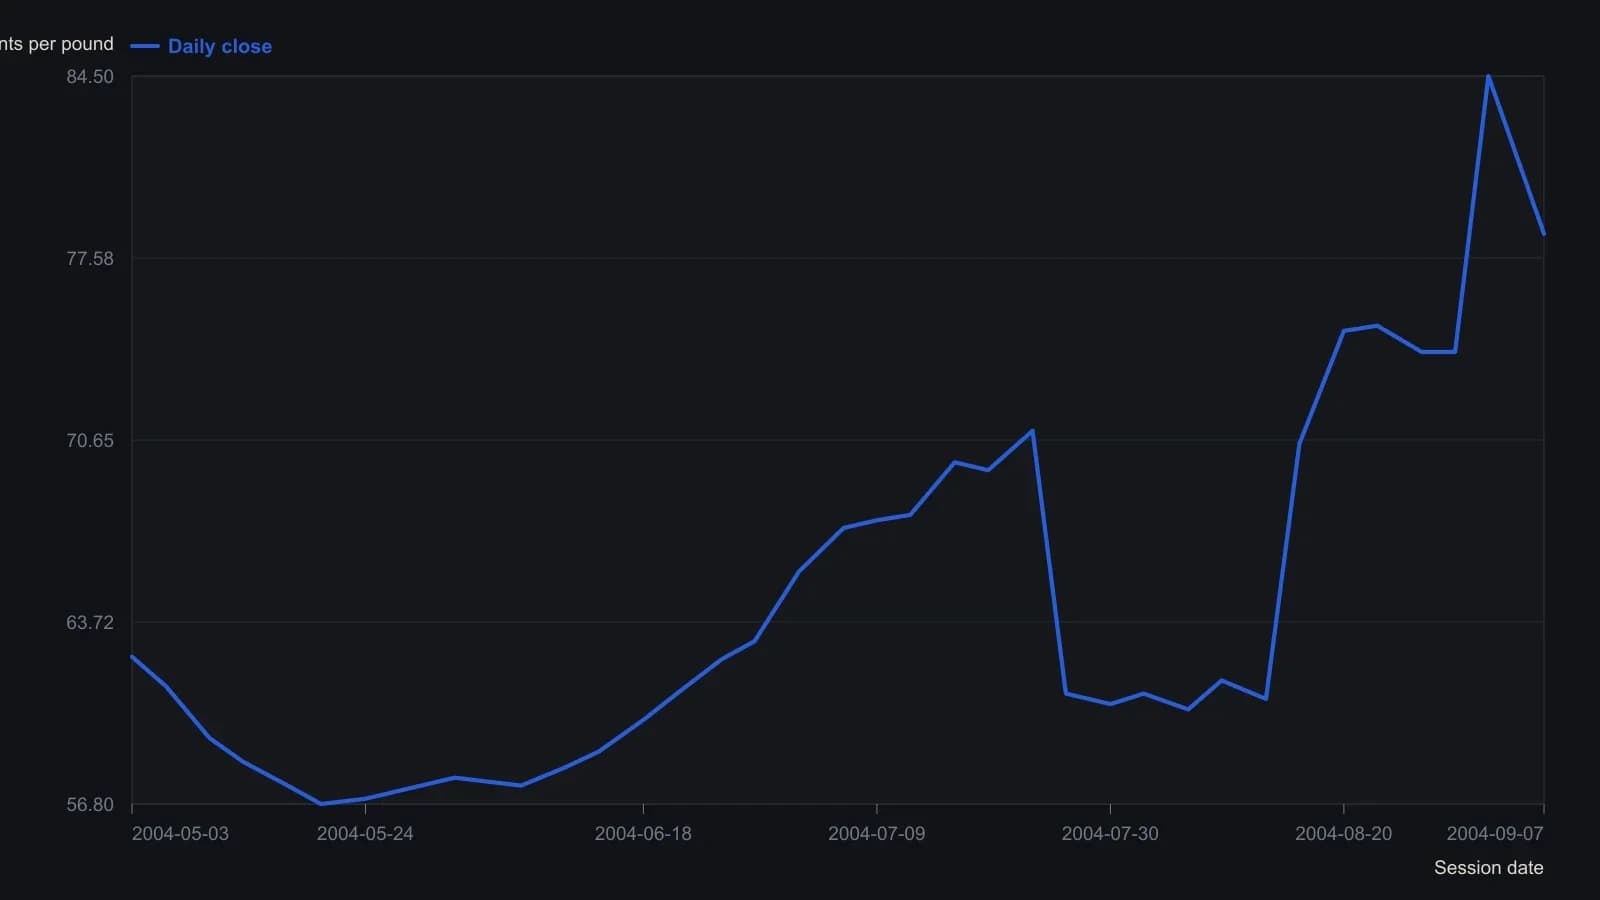
Closes between labeled sessions are visual estimates to the nearest half cent from a daily candlestick raster. Intra-bar highs and lows and the yellow gap callouts were not turned into extra series.
All readings on this track · 6 readings
- 1987Constructing price gap classifications from follow-through
- 1990Breakaway versus exhaustion: classify the skip from both sides
- 1990Constructing gap signals from skipped price zones
- 2004Constructing gap classifications from price context
- 2015Exhaustion gap entry, hold, and exit rules as one procedure
- 2016Four gap types as falsifiable trade hypotheses