2013issue C1323-37
A PHM breakaway gap stacked with Elliott labels and mapped support
The January 31, 2013 PHM session was treated as a wide-range bearish breakaway gap after a long advance. The historical workflow then stacked tentative Elliott A and B labels with pre-mapped support so a reversal idea could be confirmed or thrown out on the next swing.
- A gap after a long directional run can be read as a breakaway gap, the possible start of a new trend rather than a pause inside the old one.
- Tentative Elliott A and B labels give the gap and a later relief rally a structure the next swing can confirm or reject.
- Support near 17.30, 15.81, and 14.55, with the Keltner midline as nearer support, locates where a decline is expected to pause, hold, or fail.
- A break below 19.10 was framed only as a chart condition aligned with a test of 17.30 support, not as a finished call.
The gap after a long advance
The January 31, 2013 daily session in PHM was treated as a wide-range bearish breakaway gap after a long advance. A breakaway gap is a gap after a long directional run that is read as the possible start of a new trend rather than a pause inside the old one.
The preceding advance was dated from an October 4, 2011 multicycle low at 3.29 through a January 28, 2013 print of 21.97. That long run is the backdrop that made the gap look like a possible trend change rather than a pause.
Elliott A and B labels
The downside gap was tentatively labeled Elliott wave A, with a later relief rally assigned as wave B. Elliott wave analysis, in this workflow, is a swing-labeling scheme that assigns corrective A and B (and later C) legs so a gap and any relief bounce can be tested as a structured reversal.
Mapped support and the Keltner midline
Support was mapped near 17.30, 15.81, and 14.55. Support and resistance here means horizontal price zones and channel midlines where a decline is expected to pause, hold, or fail, used to locate nearby and deeper exhaustion.
The middle Keltner line was cited as nearer support during an A or C correction. That Keltner midline is the inner midline of a volatility channel treated as nearer-term support while a corrective A or C leg unfolds.
Distribution before the gap day
A 100-day Chaikin money flow histogram was used to argue that longer-term distribution preceded the January 31, 2013 decline. Chaikin money flow, in this use, is a longer-lookback volume-weighted flow histogram used to argue that distribution was already underway before the gap day.
A chart condition for the next swing
A break below 19.10 was framed as a chart condition aligned with a test of 17.30 support. In the archive workflow, that level pairing keeps the reversal idea tied to a later swing rather than to the gap day alone.
Construction-services 4-week and 52-week relative strength, PHM near the top
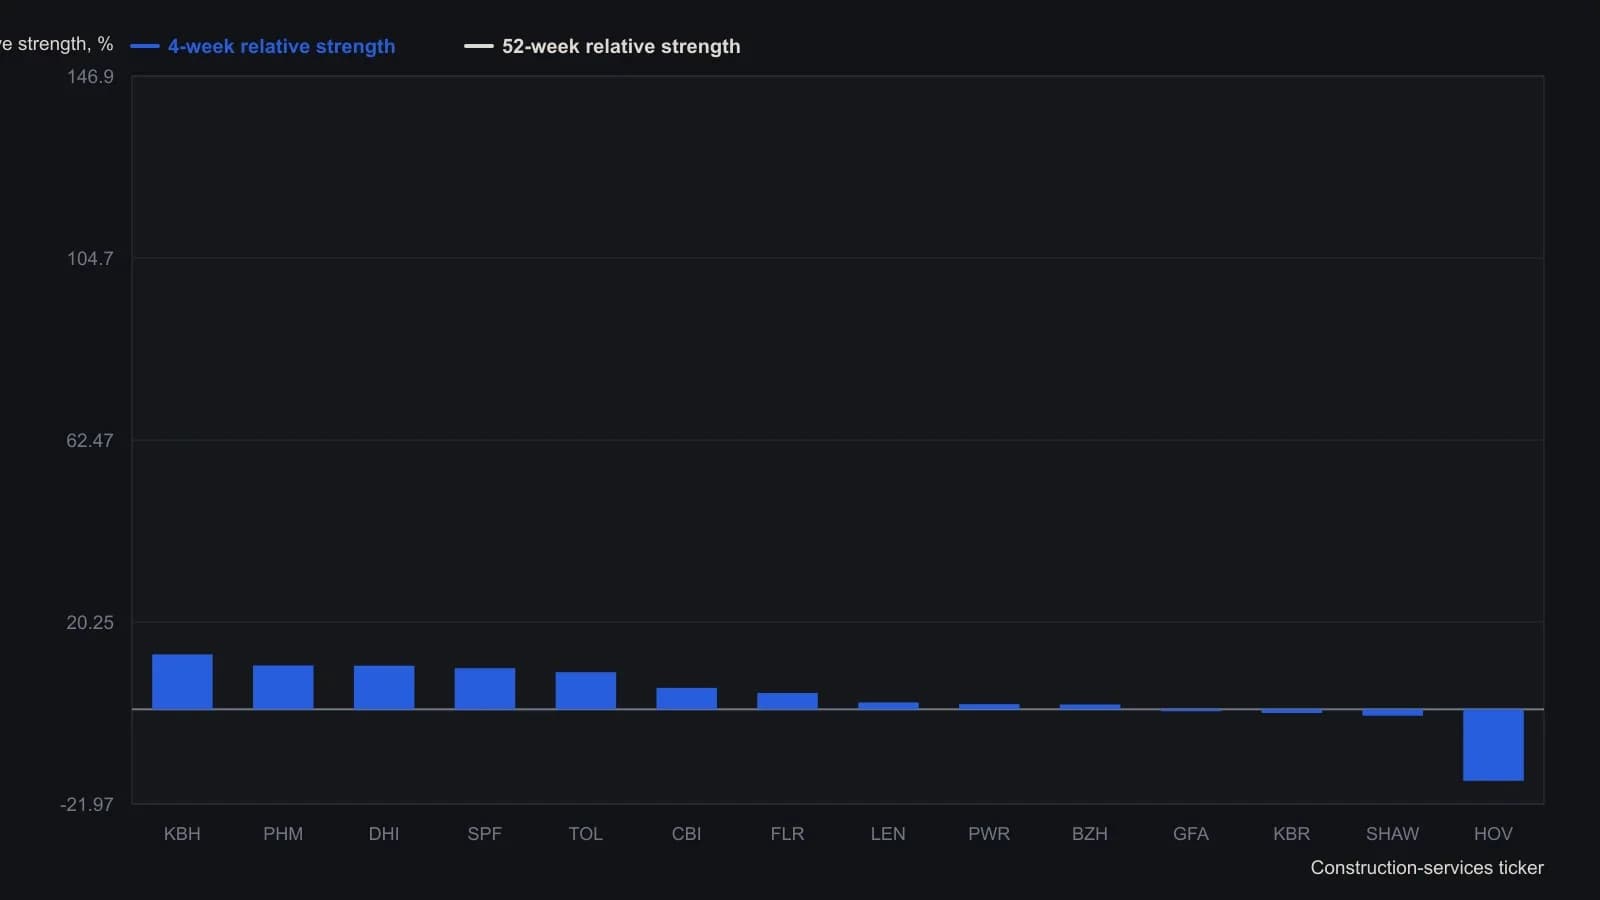
The original screen is sorted by the four-week S&P 500 relative-strength column. PHM is the highlighted row; last price in that snapshot is 19.45.
Editorial reading: confirm or throw out
TradersWeek reads the three pieces as a single falsifiable stack. First the gap is treated as a breakaway gap after a long run. Then the A and B labels give the gap and the later relief rally a structure that can fail. Then the mapped supports, including the Keltner midline as nearer support, say where that decline is expected to pause, hold, or fail.
The archive framed a break below 19.10 as aligned with a test of 17.30 support. In this editorial classroom, that is the next-swing test of the reversal idea. This interpretation is editorial. It is not a claim the archive made, and it is not investment advice.
All readings on this track · 7 readings
- 1991The midpoint retest after a missed breakaway gap
- 2011Constructing volume-confirmed breakaway gaps
- 2011The first close after a breakaway gap as a classroom breakout test
- 2011Constructing candlestick, breakaway-gap, and Elliott-wave signals
- 2013A PHM breakaway gap stacked with Elliott labels and mapped support
- 2019Breakaway gap after a completed double bottom
- 2019Evaluating upward breakaway gaps by changing one rule at a time