Stake Launches Performance Chart and Why It's Moving
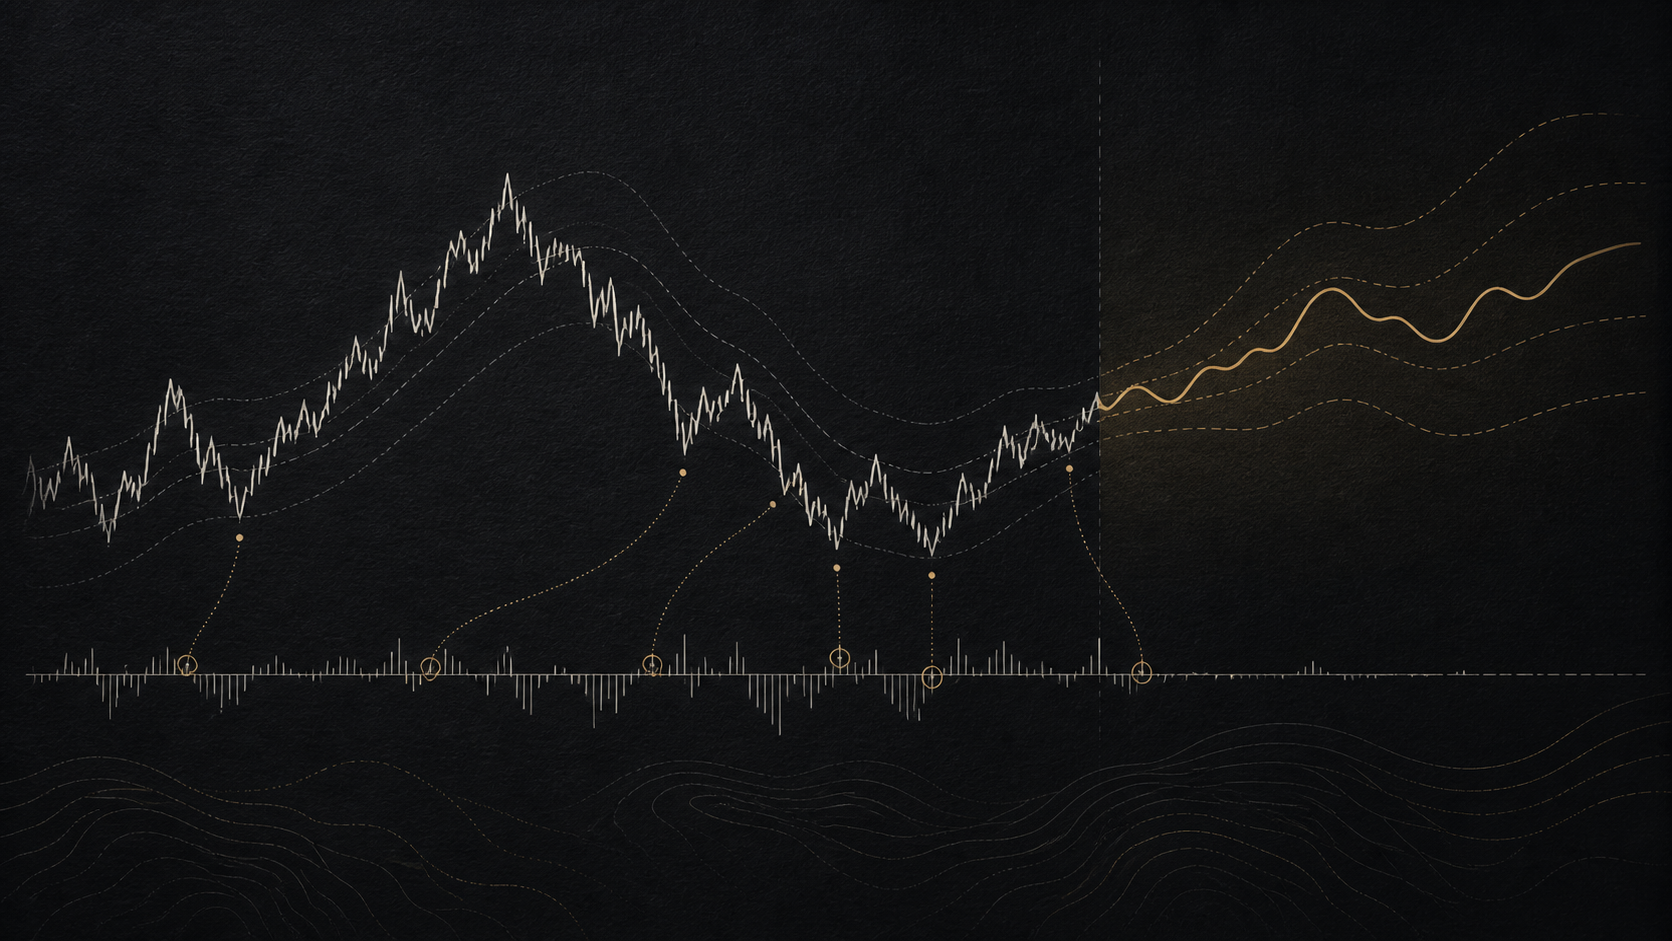
Stake introduced Performance Chart for portfolio history tracking and Why It's Moving for real-time U.S. stock movement explanations, responding to retail investor demand for transparency.
Australian investing platform Stake has rolled out two new in-app features — the Performance Chart and Why It's Moving — designed to give users clearer visibility into portfolio performance and real-time context behind major U.S. stock price moves.
The Performance Chart offers an interactive view of portfolio performance across both Australian and U.S. markets. Unlike standard portfolio snapshots that show only current positions, the tool factors in both current and sold holdings, allowing investors to see their full investing history across multiple time periods. Users can track overall performance over custom date ranges, view returns including closed positions, interact with dynamic charts using pinch-and-scrub gestures, and receive near-real-time updates while markets are open.
Bryan Wilmot, Stake's chief customer officer, said the feature was one of the most requested by active investors. “Investing is a journey, not just a daily snapshot. The performance chart is designed to give each customer a clearer understanding of how they’re tracking over time, helping them evaluate decisions with more confidence and context,” he said.
The second feature, Why It’s Moving, provides real-time summaries written by journalists that explain significant price movements in U.S. stocks. Available directly on U.S. stock pages and via notifications, the tool surfaces curated news-driven insights when a stock experiences notable volatility, helping investors quickly identify potential catalysts.
“With more content available than ever, investors don’t just need information, they need relevant information delivered in context,” Wilmot added. “Why It’s Moving does some of the heavy lifting by surfacing timely summaries in-app, combining trusted third-party news sources with human curation.”
The dual launch reflects broader shifts in retail investor behavior, where access to global markets is increasingly paired with expectations of transparency and contextual insight. By combining historical portfolio visibility with real-time market explanations, Stake aims to support more informed, self-directed investing.
The Performance Chart has rolled out to customers using the latest version of the Stake app. Why It’s Moving is now live across supported U.S. stock pages.
Source: Stake