2008issue C121-4
Weather regimes and agricultural markets: a 2007-2008 case study
A 2007-2008 walkthrough of how La Niña heat, Plains and Midwest flooding, and later rainfall shifts altered corn, soybean, and wheat yields and prices. Traders placed those moves inside ENSO, PDO, and crop-calendar regimes, using multi-week model runs and official-yield lags rather than next-day headlines alone.
- By 2008, agricultural price swings were already being treated as weather-regime events, with Plains and Midwest flooding cited as a major driver and larger funds expected to import energy-market weather methods into corn, wheat, and soybeans.
- A model-run revision can move weather-sensitive commodity prices enough to break technical support or resistance, so a seasonal rule can treat that change as a signal or as a reason to stand aside.
- ENSO frequency is tied to the PDO: a positive PDO from 1977 to 1998 favored more frequent, stronger El Niño events, while a later negative PDO like 1947 to 1977 favored more frequent, stronger La Niña events, including the winter of 2007-08.
- In 2007, state-by-state heat tracking showed corn and soybean ending-stock estimates were too optimistic before official numbers fell, because USDA and many fundamental yield updates often lag the weather evidence.
Weather as a regime, not a headline
By 2008, agricultural price swings were already being treated as weather-regime events, with Plains and Midwest flooding cited as a major driver. Larger funds were expected to import energy-market weather methods into corn, wheat, and soybeans.
This case study walks through how heat, flood, and La Niña altered corn, soybean, and wheat yields and prices. The task is placing one agricultural trade inside ENSO, PDO, and crop-calendar regimes rather than treating weather as an isolated headline.
ENSO, the PDO, and typical drought maps
ENSO is the El Niño-Southern Oscillation, the best-known year-to-year climate swing that shifts flood, drought, and temperature odds by region. The PDO is the Pacific Decadal Oscillation, a multi-decade North Pacific temperature cycle that tilts how often El Niño or La Niña events occur.
ENSO frequency is tied to the PDO. A positive PDO from 1977 to 1998 favored more frequent, stronger El Niño events, while a later negative PDO like 1947 to 1977 favored more frequent, stronger La Niña events, including the winter of 2007-08.
Typical El Niño events raise drought odds in India, Southeast Asia, Australia, Argentina, and southern Brazil. Typical La Niña events favor winter drought in the US Southeast and southern Plains and summer drought in parts of the prime US growing area in onset years.
The 2007-2008 grain walkthrough
In 2007, strengthening La Niña heat across the eastern and southern Corn Belt, Delta bean region, and Southeast cut corn and soybean yields more than USDA and prominent market forecasts implied. State-by-state heat tracking showed ending-stock estimates were too optimistic before official numbers fell.
Official-yield lag is the tendency of USDA and many fundamental houses to update crop-yield estimates more slowly than weather evidence arrives.
A later La Niña-linked rainfall improvement lifted Australian crop-yield prospects by 90% and, with better results in India and China, accompanied a winter-wheat selloff. The same year, early US drought fears eased after winter snow and spring storms saved Kansas, while non-irrigated Texas, Oklahoma, and eastern Colorado still lost yield.
Model-run revisions and human reads
Traders had shifted from using only next-day observations to using global computer models run up to four times daily and extending as far as 16 days, plus human interpretation of those runs.
A single model-run change versus the previous cycle of the same model can move weather-sensitive commodity prices enough to break technical support or resistance. A seasonal rule can treat that model-run revision as a signal or as a reason to stand aside.
Human reads of six-to-15-day model output can be used to anticipate yield and price-target changes, while USDA and many fundamental yield updates often lag the weather evidence. A crop-phase threshold is a temperature or moisture limit that matters only in a specific growth stage, such as pollination or grain fill.
Soybean seasonal composite, 40-year versus 15-year
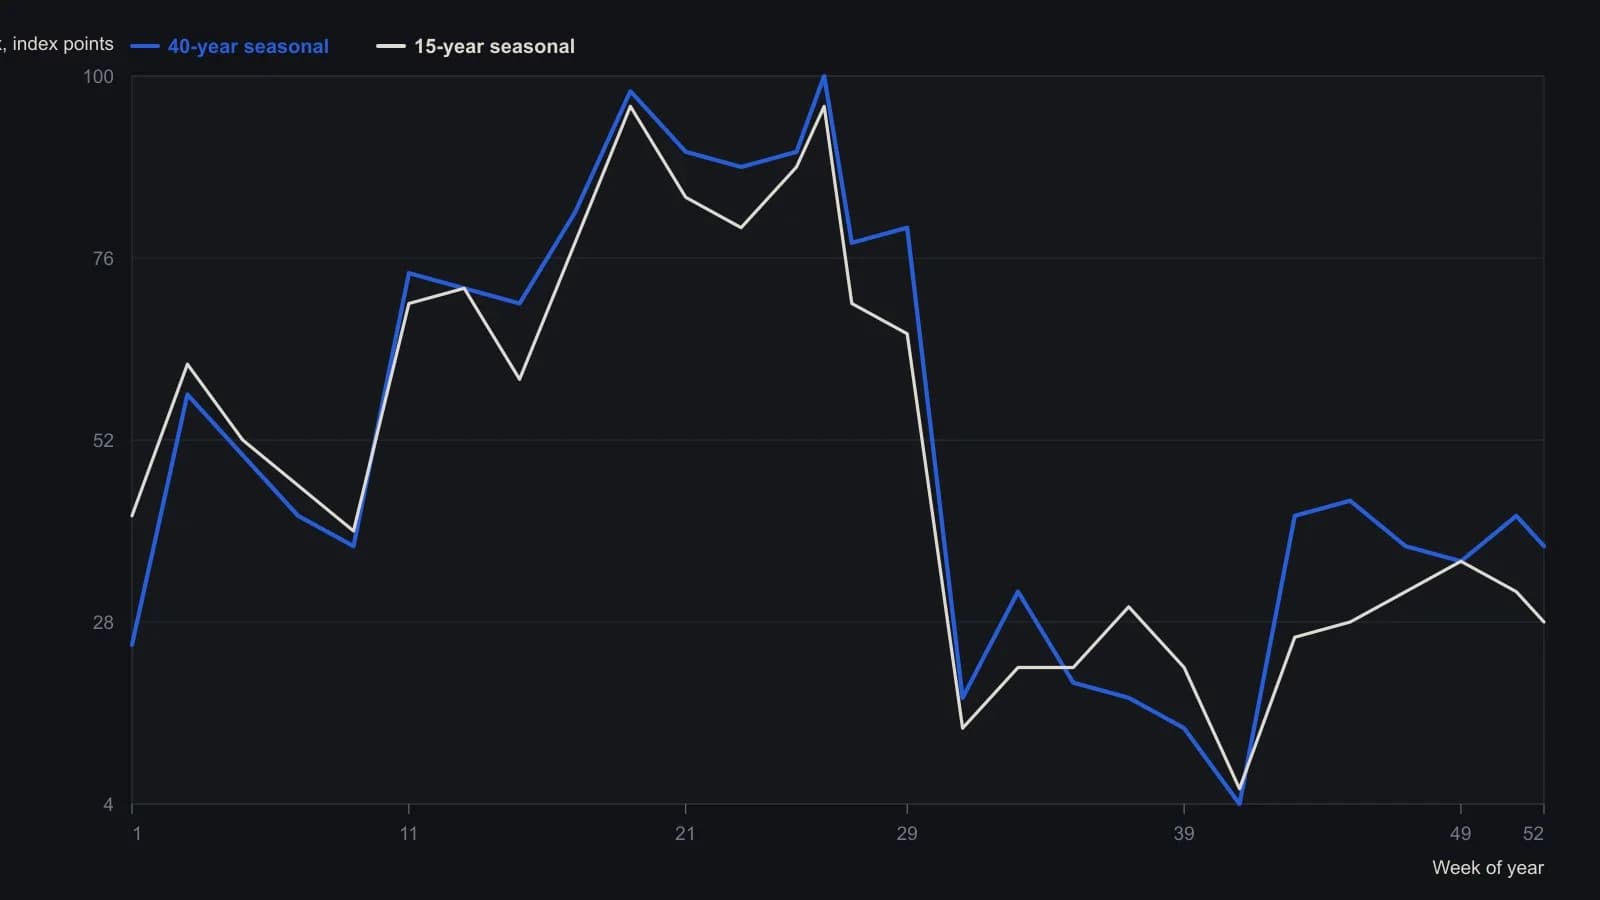
Readings are approximate from the printed 0–100 seasonal composite. The 40-year window is 1960–1999; the 15-year overlay is the shorter companion series on the same scale.
How the three methods fit
Editorial synthesis: seasonality analysis reads those multi-week to multi-month weather and crop-phase windows so a single agricultural trade sits in a diversified or regime-aware context. Seasonal trading turns forecast revisions, crop-phase thresholds, and official-report lags into testable entry, exit, or abstention rules for the holding period. Scenario risk analysis bounds loss and exposure before entry by asking whether a drought, flood, or delayed-planting path can break the position.
The archive facts describe that historical workflow. They do not say which revision or scenario is large enough now.
All readings on this track · 15 readings
- 1985Event-class hazards and pre-trade survival checks
- 1985Exchange controls that close the trading-window
- 1989Scenario-checked short-call income versus directional premium
- 2003American cash-settled debit spreads run on two clocks
- 2006Trading survival as a precommitted decision process
- 2006Storm season, futures weather regimes, and contract size
- 2007Country and sector sleeves as a construction choice
- 2008Weather regimes and agricultural markets: a 2007-2008 case study
- 2010Grain price regimes start with the crop cycle, the dollar, and leftover inventories
- 2015Convert year-ahead forecasts into if-then checklists
- 2016A forecast is a hypothesis, not a sizing license
- 2016The commodity hold-forever thesis fails drawdown and ruin screens
- 2020Forecast safety after rare market shocks
- 2020Reserve-currency regime, productivity shocks, and scenario filters
- 2020Handing a futures account to a manager is still a ruin problem