2006issue C101-4
A high-volume wide bar as an auction-intent check
Volume-price analysis judges a spike by range and close location before treating it as demand. The archive case then used a Stochastic oscillator only after that bar already pointed to selling into strength.
- Volume-price analysis reads bar volume, high-low range, and close location together rather than treating a volume spike as a breakout.
- A wide up bar that spikes in volume and closes mid-range or low is treated as selling into strength, especially after a gap in an uptrend.
- A Stochastic oscillator crossover was offered as short confirmation only after that bar reading already pointed to professional selling.
- The source cautions that a matching spike does not make a decline inevitable, and that a mid-range close after heavy participation can still mark unfinished distribution.
Reading volume, range, and the close
Volume-price analysis reads each bar through three jointly observed variables: bar volume, the high-low range, and where the close sits inside that range.
The source distinguishes bar range from the bid-ask spread and allows the same method to be called volume range analysis when the high-low width is the object of study.
Selling into strength on the soybean chart
A volume spike on an up bar with a wide range and a mid-bar or low close, especially after a gap in an uptrend, is treated as selling into strength rather than unopposed demand.
A daily soybean chart is used to show that such up-bar volume spikes preceded subsequent down moves.
Soybean daily closes around the June 2006 volume spike
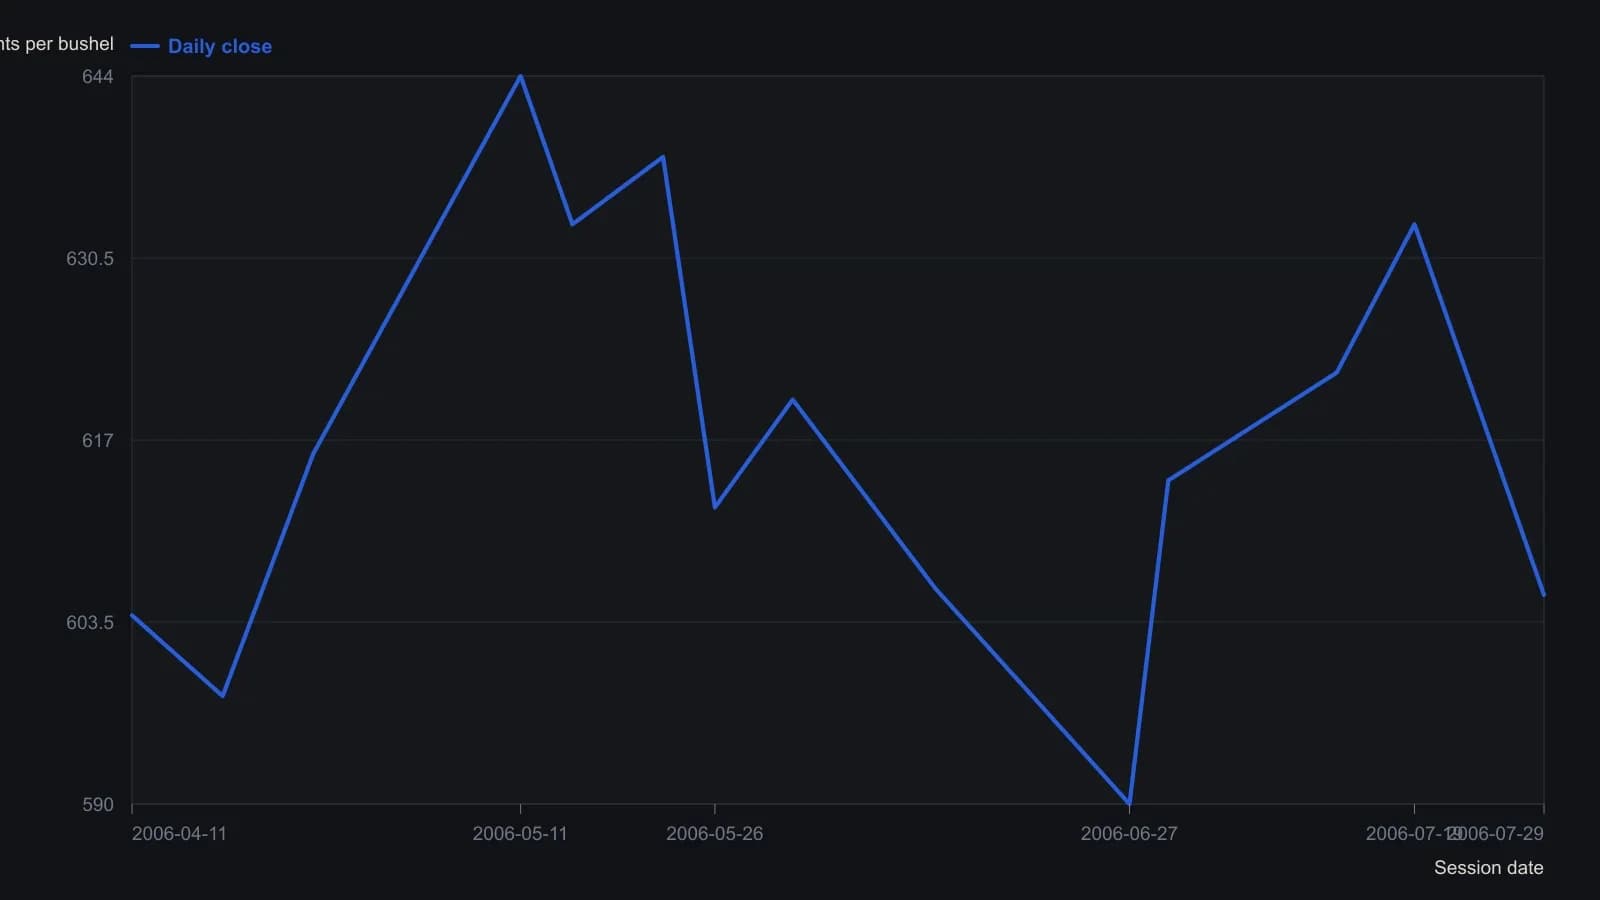
Intermediate closes are approximate to about two cents; the raster does not support quarter-cent ticks. The 30 June bar is the acreage-report session. Volume is visible on the source pane but is not recovered as a numeric series.
Confirmation after the bar reading
On an intraday example, a Stochastic oscillator crossover is presented as a short confirmation only after the volume-range close reading already showed professionals selling into the herd.
Volume-price analysis is offered as a confirmation overlay that can keep a trader out of news-driven entries that conflict with professional supply or demand already visible on the chart.
The same reading across scales
The same bar reading is applied from one-minute to monthly charts and across markets because the method treats professional supply and demand as scale-independent.
A rule of thumb in the source attributes most volume on a typical histogram bar, or of tick activity when true volume is unavailable, to larger professional size.
All readings on this track · 12 readings
- 1988Constructing a value area from TPO, volume, and order flow
- 1988Constructing Value Area trends from half-hour auction profiles
- 1988Constructing auction structure with volume as a clock
- 1999Direct access routing and the visible book
- 1999A floor-to-screen case for the trading decision
- 2001Round-number clusters behind support and pattern signals
- 2001Displayed-size filters in multi-venue index-share execution
- 2006A high-volume wide bar as an auction-intent check
- 2007Market Profile as auction context for inventory imbalance
- 2008Decimalization, liquidity, and why price-only charts miss the tape
- 2013Liquidity pockets and order routing after the speed race
- 2015Bid-ask queues and the instant-adjustment critique