1988issue C101-7
Constructing auction structure with volume as a clock
A complete session display can be assembled from three projections of the same tape. Traded size can replace the wall clock once the time-volume path settles, which separates a mature auction from an immature order-flow regime.
- Three coordinated projections of the same tape assemble a complete market-structure display: a price-side volume histogram, in-bar size at each price, and period totals along time.
- Cumulative traded size can replace the wall clock when the time-volume line settles toward a stable slope. A path that will not settle marks an immature session.
- Histogram peaks form contiguous high-intensity bands that can be read as separate auction regions. A new band marks a break from the prior region's expectations.
- Each fill is treated as an atomic change in holdings. Observed price and size do not reveal which information each side used.
Build the session from tape atoms
A complete market-structure display can be assembled from three coordinated projections of the same tape: a price-side volume histogram, in-bar size at each price through the session, and period totals along the time axis.
Session progress can be measured either by elapsed clock time or by cumulative traded size, because each transaction changes the structure of holdings by exactly the quantity that changed hands.
Clock units and volume atoms
Both clock units and volume units are discrete and irregular conventions. Worldwide continuous trading makes a single local clock a weak locator of where the auction currently is.
A volume-dimension chart keeps price on the vertical axis, bins the horizontal axis in volume atoms, and uses time spent at each price as intensity. Projecting that intensity onto price yields a time profile.
Volume profile and sub-markets
The volume profile is a constructed price-side view that projects traded size onto price so peaks and contiguous high-intensity bands can be read as auction structure.
Histogram peaks form contiguous high-intensity price bands that can be analyzed as separate auction regions. A new band typically marks a break in the expectations that governed the prior region.
Session analysis segments activity into clock or volume atoms and into those successive high-intensity price regions. Each contiguous band can be treated as a sub-market, so one auction window can be compared with the next. Prior expectations no longer bind once a new band forms.
Major Market Index volume at price, two sub-markets
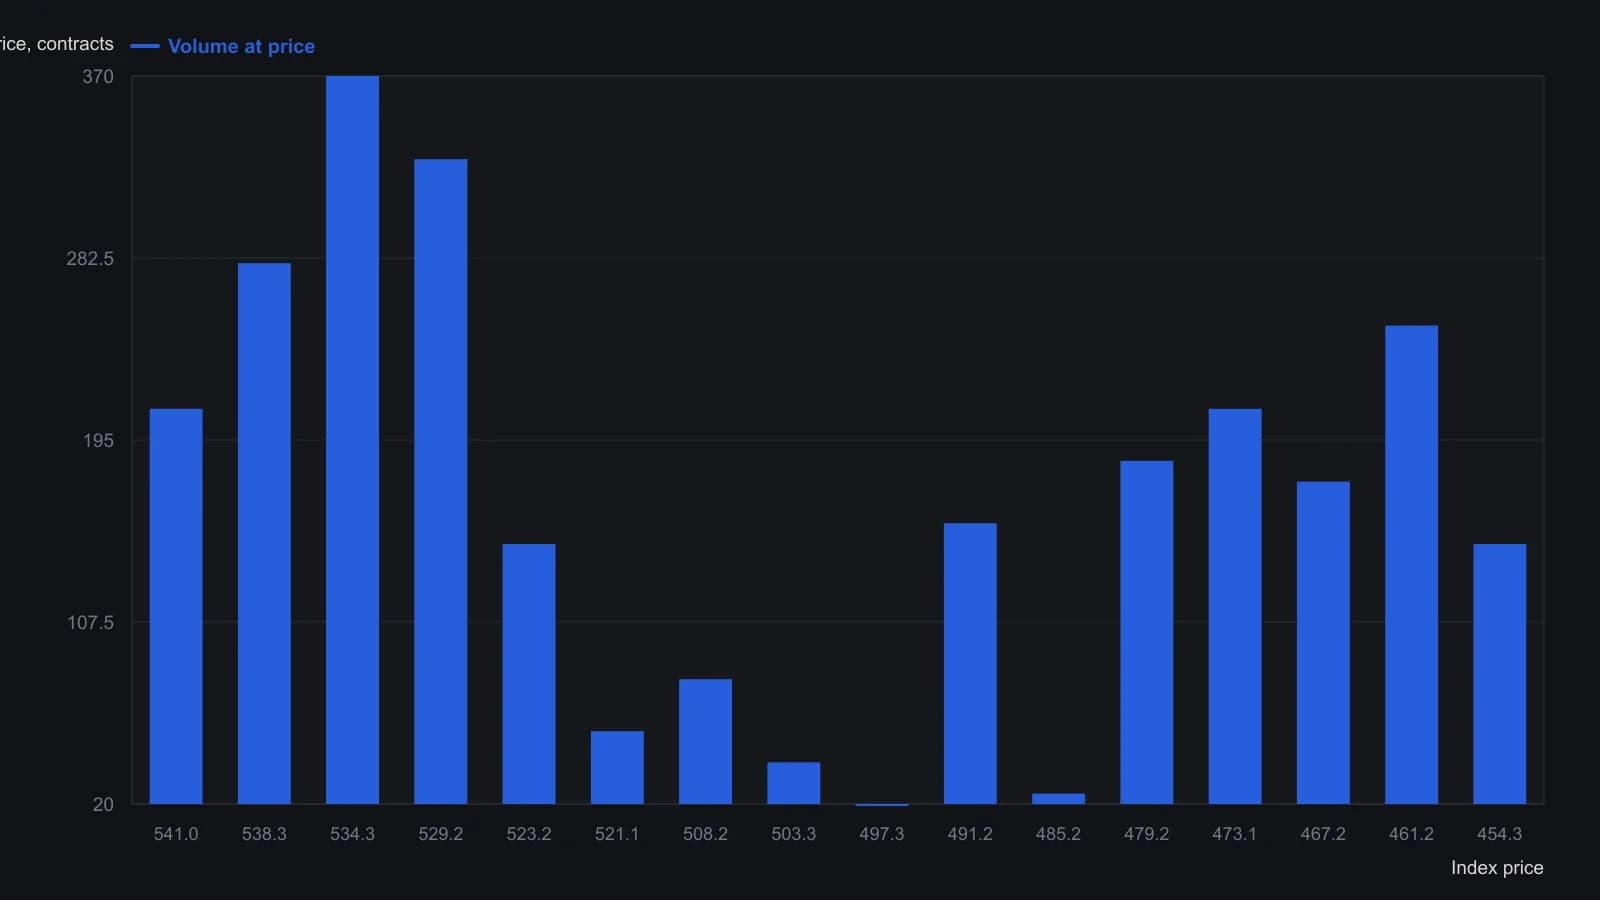
Price labels are those printed on the figure; bar lengths are estimated against the 0–425 volume scale at the top. A thin gap near 515–518 is the break between the two sub-markets named in the article.
One three-axis construction
Time, price, and volume can be joined in one nonnegative three-axis construction, the TPV graph, with price vertical and with time and volume as nonnegative horizontal axes. The familiar time-based and volume-based structure charts are its projections onto the two planes that contain price.
A change-space companion
A change-based companion chart, delta TPV, uses signed price increments and unsigned time and volume increments. Fixing the calendar window collapses the points onto a plane. Using occupancy of successive high-intensity bands as the window preserves more structure.
When volume can stand in for the clock
On the time-volume plane the path advances only in positive time and volume steps. Viewed from a distance, that time-volume line tends toward a straight line whose slope is average size per unit time, so volume can stand in for the clock.
The time-volume path fails to settle toward a stable slope when the instrument is newly traded or its market structure is still changing. That failure marks an immature session rather than a usable volume clock.
Fills as atomic events
Observed price and size do not reveal which information each side used. Under a tape-only construction, order-flow analysis treats a fill of a given size at a given time and price as an atomic event, and volume per unit time is read as the arrival rate of information.
Each fill is read as a change in participant holdings, using observed size and timing rather than inferred motives or information quality.
All readings on this track · 12 readings
- 1988Constructing a value area from TPO, volume, and order flow
- 1988Constructing Value Area trends from half-hour auction profiles
- 1988Constructing auction structure with volume as a clock
- 1999Direct access routing and the visible book
- 1999A floor-to-screen case for the trading decision
- 2001Round-number clusters behind support and pattern signals
- 2001Displayed-size filters in multi-venue index-share execution
- 2006A high-volume wide bar as an auction-intent check
- 2007Market Profile as auction context for inventory imbalance
- 2008Decimalization, liquidity, and why price-only charts miss the tape
- 2013Liquidity pockets and order routing after the speed race
- 2015Bid-ask queues and the instant-adjustment critique