2007issue C131-3
Constructing Gann time-price squares, angles, and 144 grids
This article shows how to convert a notable currency extreme into a time-price square, seat the cell on a square of nine, draw Gann degree rays through the origin, and add a Fibonacci 144 box for longer-horizon price and time.
- A time-price square converts a notable high or low into an equal calendar count and treats the resulting date as a hypothesized reversal window.
- The square of nine is a clockwise spiral centered on 1; Gann degree rays through that origin mark candidate price and calendar intersections.
- From a peak the degree steps run counterclockwise, from a low they run clockwise, and support or resistance is read along a row or a diagonal.
- The Fibonacci 144-by-144 box frames longer-horizon support, resistance, and subdivided day, week, month, and year windows.
Convert the extreme into a time-price square
A time-price square turns a swing high or low into an equal count of calendar units and treats the resulting date as a hypothesized balance of time and price. The count is taken in days or longer units and added to the date of the extreme. The resulting date is treated as a hypothesized reversal window.
On a euro/dollar chart, a 1.3666 peak on 30 December 2004 was reduced to 136 and counted forward 136 days to 8 July 2005. A secondary low printed that day at 1.1876 after a 5 July low at 1.1870.
Euro/dollar from the December 2004 high through the July 2005 time-price square
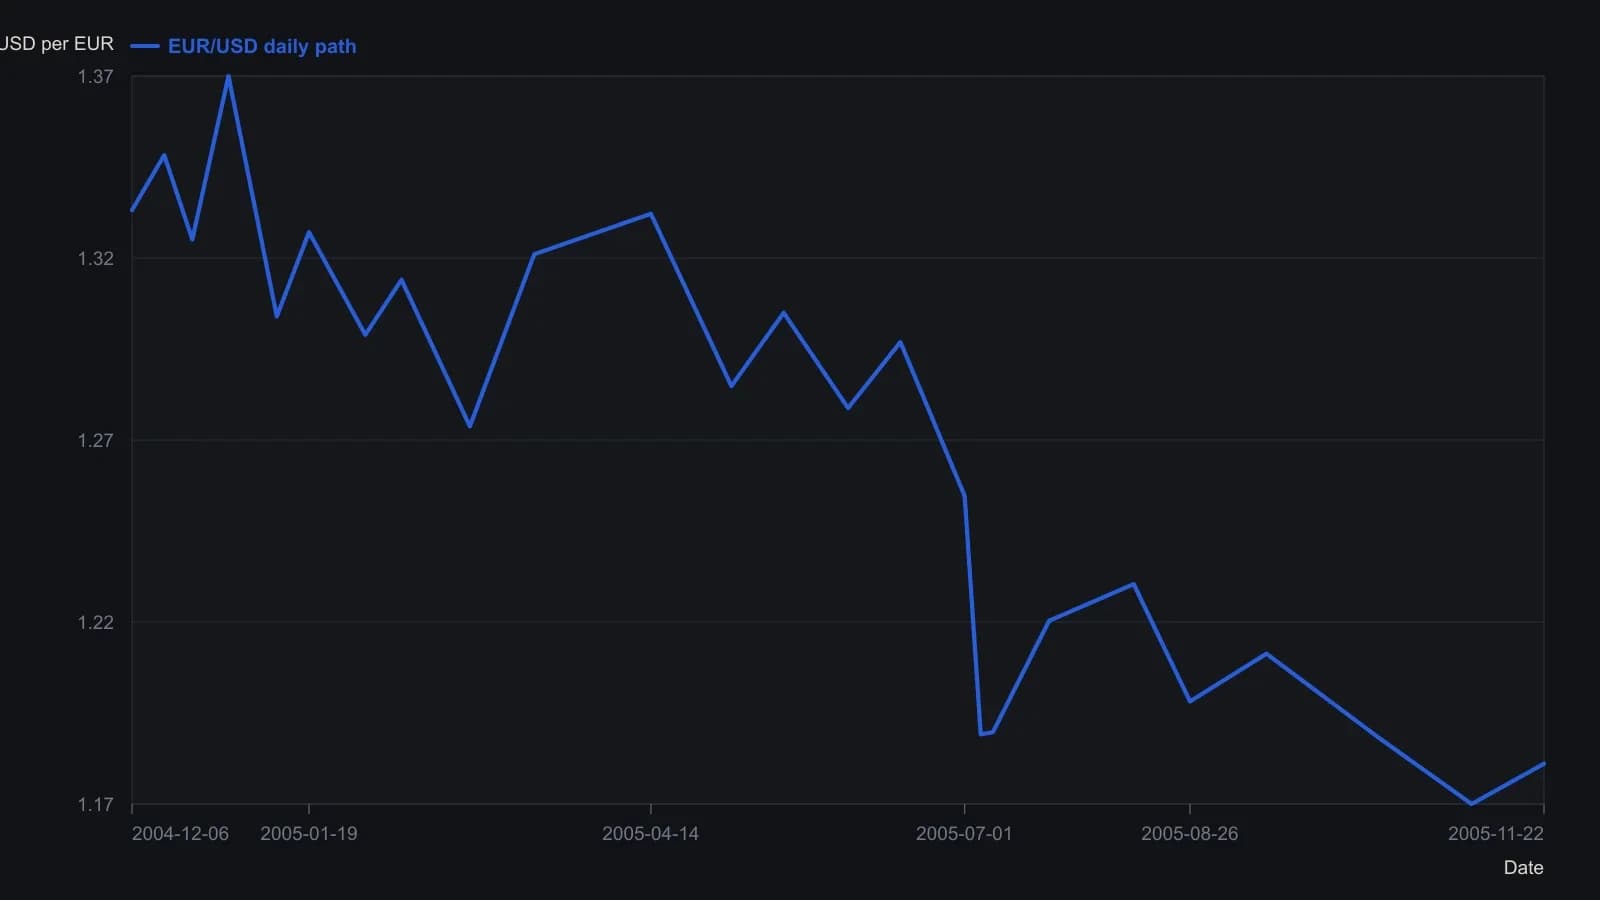
Only the 30 December 2004 high (1.3666) and the 5–8 July 2005 lows (1.1870 and 1.1876) are stated in the article. All other prices are approximate readings from the Figure 1 raster, resolved to about 0.005 against the printed 0.0156 ladder.
Seat that cell on the square of nine
The square of nine is a clockwise number spiral centered on 1. Odd-root squares 9, 25, 49, 81, and 121 run from the lower-left corner, and even-root squares 16, 36, 64, and 100 run from the center toward the upper-right corner. Rows and diagonals supply candidate support, resistance, and 180-degree trend-change cells.
From a significant low the construction steps clockwise through 90, 180, 270, and 360 degrees. From a significant peak the same degrees are stepped counterclockwise. The arc from 16 (4 squared) to 25 (5 squared) is treated as a 180-degree trend-change interval, and support or resistance is read along a row or a diagonal.
A dollar/yen low near 80.00 in April 1995 sits at the lower-left of the square. Later weekly peaks near 120, later lows near 102, and 1998 highs near 146-147 occupy the same row or diagonal family as 80 and 102.
Fire Gann degree rays through the origin
Gann angles are fixed-degree rays, the 90/180/270/360 family and the 45-degree offsets, drawn from a swing cell through the square origin to mark candidate price and calendar intersections.
A combined time-price construction locates the swing date on the square of nine and draws standard Gann angles through the center cell (1). Prices that fall on those rays are treated as candidate highs or lows.
Project calendar counts and natural squares
Primary Gann timing counts of 30, 90, 120, 180, and 360 days, plus secondary counts of 45, 135, 225, and 315, are projected from a swing point as candidate reversal dates.
The solar-degree calendar maps 90/180/270-degree arcs from the 21 March equinox, optionally scaled by 1.01389, onto solstice and equinox windows. From the 21 March solar-year start, a 90-degree count lands near 22 June, a 180-degree count near 21-23 September, and a 270-degree count near 21-22 December. When counting days, the 90/180 family may be multiplied by 1.01389 to give 91.25 and 182.5.
Natural squares are integer squares added to or subtracted from a swing price or date to mark length-of-move and calendar checkpoints. From a 1.2978 euro/dollar high, subtracting 441 (21 squared) and 484 (22 squared) produced constructed downside levels of 1.2537 and 1.2494. A 121.40 high is simplified to 121, the square of 11.
Drop a Fibonacci 144 box
Fibonacci-linked boxes and ratio overlays, especially the 144-unit square, are used to frame longer-horizon support, resistance, and subdivided time windows. The square of 144, identified as a Fibonacci number, is a 144-by-144 box used on longer-horizon charts for support, resistance, and time.
144 times 144 equals 20,736, which is then divided into day, week, month, and year windows: 20,736 days, 2,962 weeks, 682 months, and 56.8 years at the full unit.
All readings on this track · 12 readings
- 1988Four sugar-futures turns as a ranked wave-ratio audit
- 1989Cluster-first construction of change-in-trend days from two ratio families
- 1992Wheat bull leg from a squared counterswing and Gann angles
- 1999Log-spiral wave construction from seed pivots
- 1999Compound pivots and market symmetry
- 1999Squaring charts for Gann angles
- 2007Constructing Gann time-price squares, angles, and 144 grids
- 2010Constructing Gann angles to square price and time
- 2011How a Lucas time series is built onto an Elliott wave map
- 2013Time-price boxes for wave-four construction
- 2016Gann circle eighths, Fibonacci neighbors, and time-price squares
- 2016Constructing wave cycles, Fibonacci spans, and time-price squares