2001issue C051-2
Soybean crop regimes, triangles, and channel breaks
Soybean futures can embed a risk premium while future supply still looks scarce. This archive article uses the crop calendar as an editorial filter: count an ascending-triangle or price-channel break only in a planting, pod-set, or late-harvest window, and read the same geometry as ordinary noise once the crop is known.
- This editorial reading counts an ascending-triangle or price-channel break only in planting, pod-set, or late-harvest windows, and treats the same geometry as noise once the crop is known.
- Soybean futures are described as embedding a risk premium when future supply looks scarce, then moving back toward levels more consistent with current supply and usage once that outlook clarifies.
- A false break below support followed by an ascending-triangle upside breakout was used to mark a typical planting rally as risk premium built through March and April.
- Projected record output and post-harvest surplus fear produced September to October weakness in a descending price channel, then a November upside break aligned with a late-harvest rebound and high on-farm holdings.
Risk premium and unresolved supply
Soybean futures are described as embedding a risk premium when future supply looks scarce, then moving back toward levels more consistent with current supply and usage once that outlook clarifies. The extra futures price appears when traders treat future supply as tighter than current stocks and usage imply, then fades as that outlook becomes clearer.
Seasonal trading uses the planting, reproductive, and harvest calendar as a repeatable window for when supply uncertainty should expand or contract. TradersWeek editorial reading: treat that calendar as a supply-certainty regime filter. Count an ascending-triangle or price-channel break only when it lands in a planting, pod-set, or late-harvest window where future supply is still unresolved, and read the same geometry as ordinary noise once the crop is known.
Planting window and the ascending triangle
Early-2000 drought and soil-moisture concern was followed by a sharp January rise in July soybeans and then a February setback attributed to producer selling. Late in February 2000, July soybeans slipped under earlier-month support and then reversed through resistance during a calendar window characterized as a traditional soybean rally period.
A false break below support followed by an ascending-triangle upside breakout was used to mark the start of a typical planting rally as risk premium built through March and April. An ascending triangle is a rising-lows and flat-resistance structure whose upside break is treated as a falsifiable trend-change hypothesis. The planting window is the spring period when new-crop supply is still unresolved and soybean prices often attempt a seasonal advance.
TradersWeek editorial reading: that upside break is counted because it sits in the planting window, where future supply is still unresolved.
July 2000 soybeans: planting-window triangle break
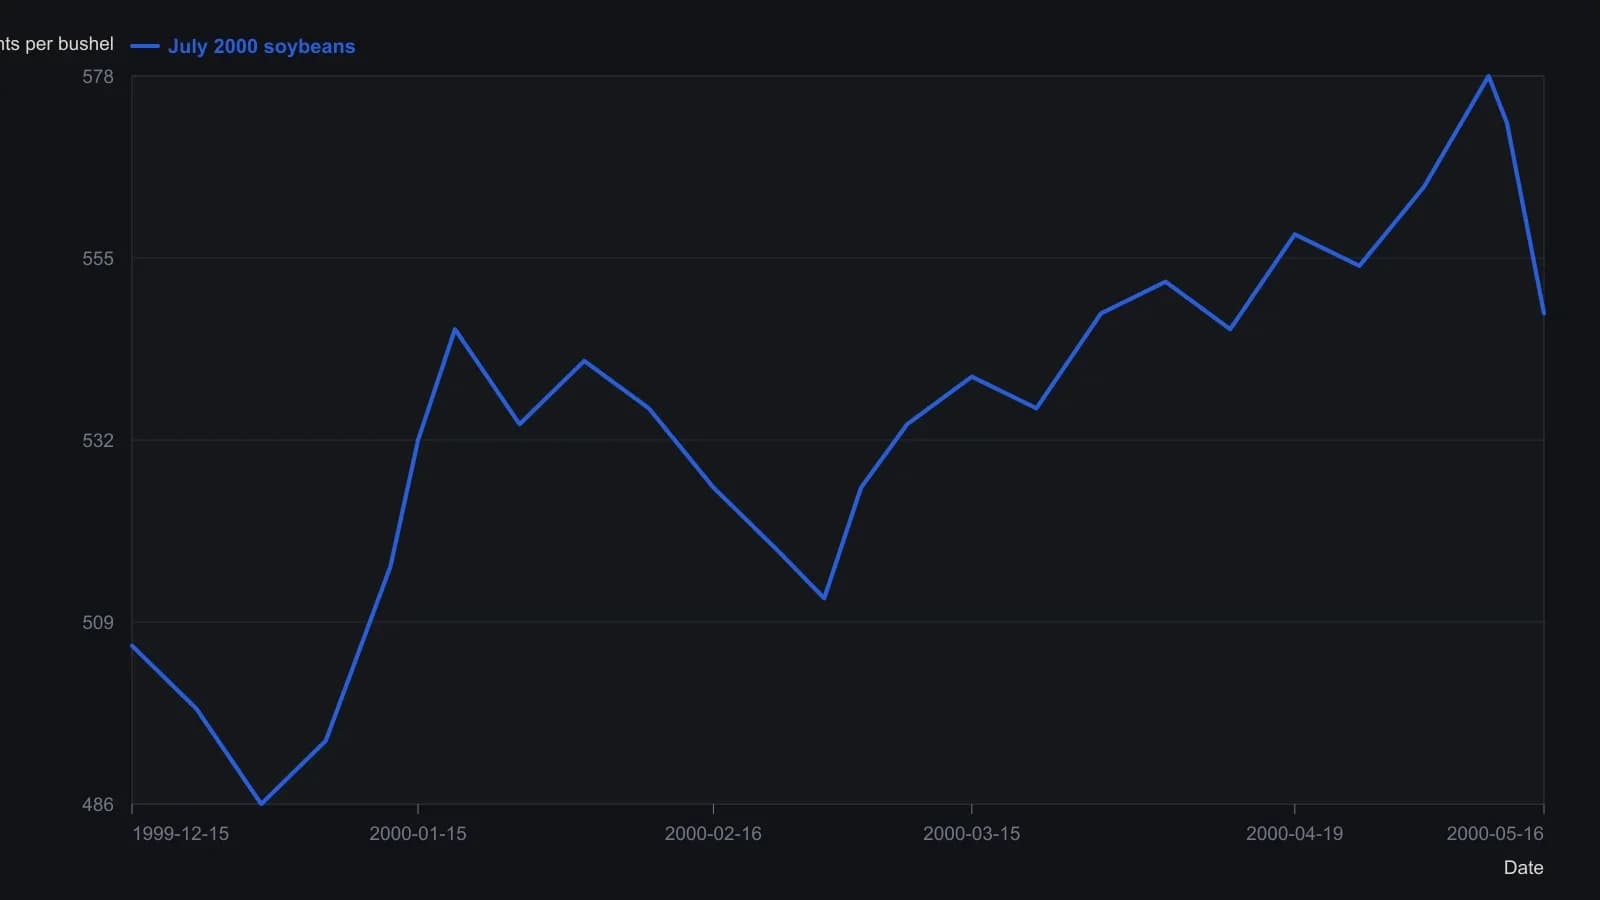
Digitized from daily candlesticks on the Gecko Charts 2000 print of the July 2000 contract. Prices are approximate to a few cents; week dates are inferred from the monthly axis labels.
Pod-set and the August advance
A second 2000 advance formed in August as the crop entered its reproductive, pod-setting phase and heat-and-dryness worries about yield rose. After mid-July contract lows, a support retest plus an upside break of resistance was presented as the technical condition for a long soybean stance.
August is characterized as a typically strong soybean month because the crop is in its reproductive phase and future supply remains uncertain. TradersWeek editorial reading: the August resistance break is counted because it lands in the pod-set window, not because the geometry is different from breaks that occur after the crop is known.
Harvest pressure and the channel break
A price channel is parallel support and resistance that contain a directional swing until a break ends that swing. Projected record output and post-harvest surplus fear produced September to October weakness structured as a descending price channel. That stretch matches harvest pressure: autumn selling tied to a clearer, often larger, crop moving toward the market.
A November upside break of that descending channel was aligned with the usual late-harvest rebound, high on-farm holdings, and European mad-cow speculation about meal demand. On-farm holdings are soybeans kept by producers instead of being delivered promptly after harvest.
TradersWeek editorial reading: once projected output is treated as known, the descending-channel geometry is ordinary noise. The November upside break is counted because it lands in the late-harvest window.