2005issue C011-2
Reading triangles as volatility coils
Treat ascending, descending, and generic triangles as the same compression problem until price leaves the converging boundaries. Historical equity charts then show how the label, the volume impulse, and the width-based objective are assigned after the coil releases.
- A triangle is a congestion zone whose upper and lower trendlines converge to the right and can resolve as continuation or as reversal.
- While the pattern is forming, the traded range compresses and volatility falls; the coil is released only when buyers or sellers overwhelm the other side.
- Some traders treat most triangles as symmetrical until price exits the converging trendlines, because a break against the usual directional bias can still be forceful.
- A practical reading is to let price leave the pattern before acting, then apply the measurement rule from the widest span at the breakout or breakdown.
A congestion zone that can continue or reverse
A triangle is usually treated as a continuation pattern. It marks a pause after a trend has extended, and the prior direction often resumes once that pause ends. Continuation is resolution that resumes the direction in force before the triangle formed.
The same structure can act as a reversal. That role is described as uncommon, but once the tightening range of rising lows and falling highs resolves, the objective taken from the base width is often reached quickly. Reversal is the less common resolution that ends the prior trend once the tightening range is broken.
Structurally, a triangle is a congestion area whose upper and lower boundaries converge to the right and may resolve either as continuation or as reversal. The triangle pattern is that congestion zone, bounded by upper and lower trendlines that converge to the right.
While the pattern is forming, the traded range compresses and volatility falls relative to earlier volatility. The coil is a description of the same structure as stored energy: a compressed range and reduced volatility that can expand once one side overwhelms the other. The coil is released only when buyers or sellers overwhelm the other side.
Wait for the exit before the label
Ascending triangles pair flat resistance with rising support and are often continuation structures in uptrends. An ascending triangle has horizontal resistance and rising support, and is often treated as continuation inside an uptrend.
Descending triangles pair flat support with falling resistance and are often continuation structures in downtrends. A descending triangle has horizontal support and falling resistance, and is often treated as continuation inside a downtrend.
Some traders still treat most triangles as symmetrical until price exits the converging trendlines, because a break against the usual directional bias can still be forceful. A practical reading of an emerging triangle is to let price leave the pattern before acting, rather than trading an assumed direction from the shape alone.
Historical charts after the coil releases
On a Monsanto chart, a nearly symmetrical triangle in a late-September-through-October advance broke out on very high volume on October 26. The measurement rule is a minimum-objective method that adds or subtracts the widest span of the triangle at the breakout or breakdown level. Adding a two-point widest span to a breakout near 39 implied a minimum upside of 41, and the stock was later near 42 1/4.
On a Vulcan Materials chart, an ascending triangle breakout on heavy volume on September 30 was followed by a descending triangle breakdown on similarly heavy volume. The descending triangle measurement subtracts the widest span from the breakdown level. In the Vulcan Materials case a span of about 1 1/2 from a breakdown near 50 1/4 implied a minimum downside of 48.75, and the stock later closed near 47.
Monsanto daily closes through the October triangle
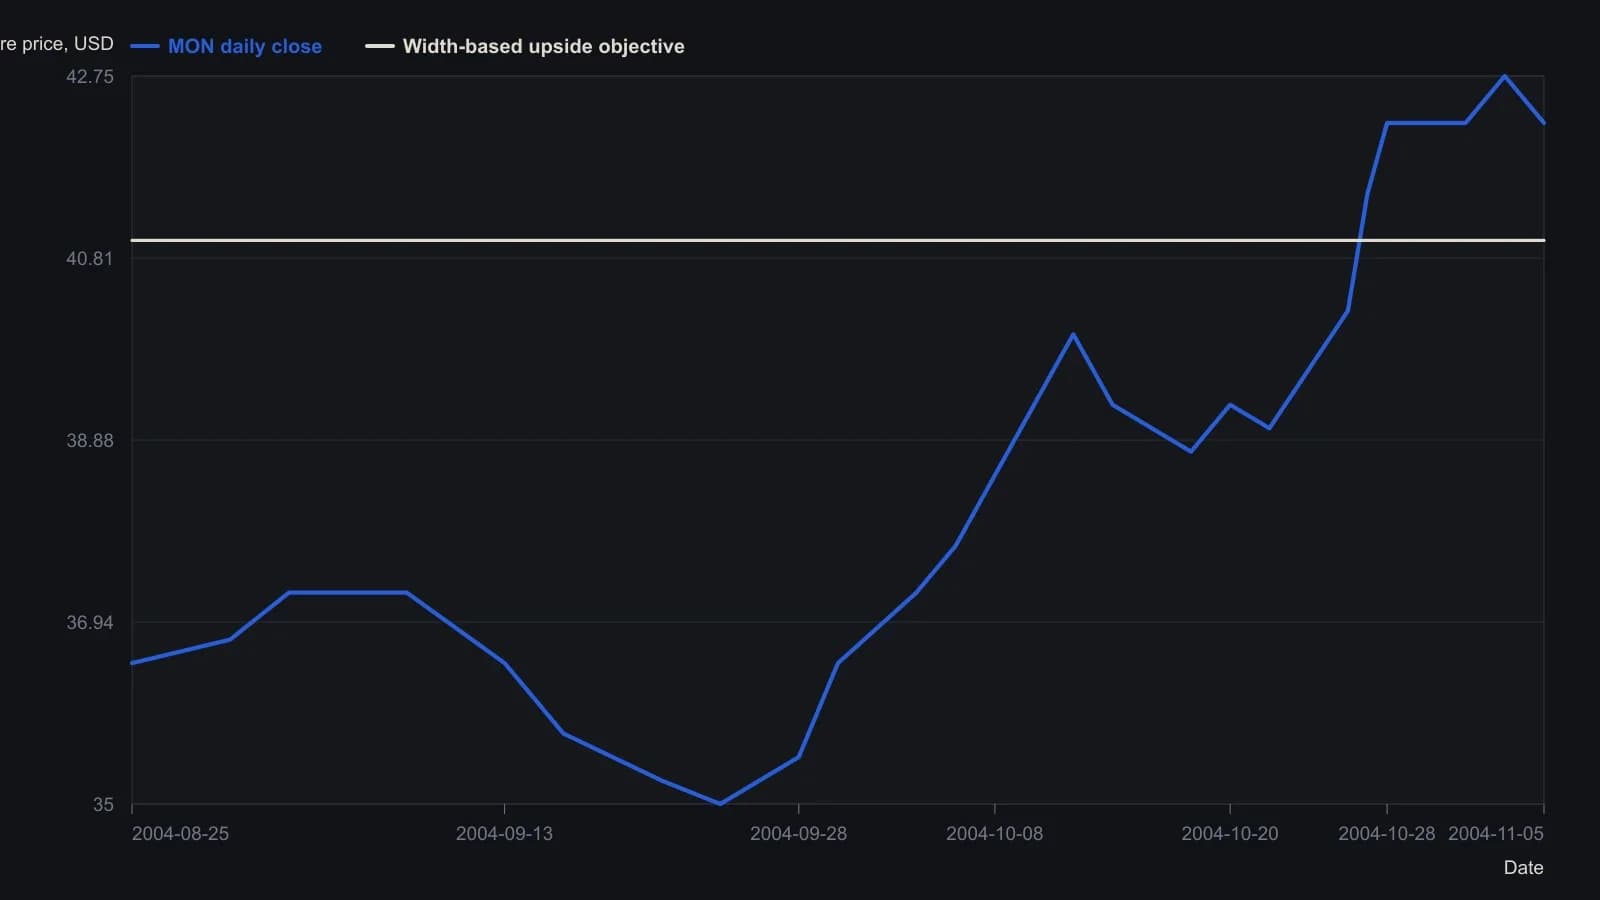
Closes are read from the daily bars at about quarter-point resolution. The 26 October breakout date comes from the article; other session dates are inferred from the printed Sep–Nov month ticks and the bars to the left of September. The 41 reference is the width-based objective stated in the text, not a line drawn on the original figure.