1996issue C111-6
Ascending triangle and Descending triangle breakout case study
A Triangle pattern can pause a trend or mark the last stage of that trend before a reversal. An Ascending triangle is treated as an upward-breakout setup, and a Descending triangle is treated as the inverse downward-breakout hypothesis. The same geometry can fail when demand fades, and waiting for the hypothesized breakout is presented as a trade-off between the win-loss record and some profit potential.
- A Triangle pattern can act as a pause after a trend or as the last stage of that trend before a reversal.
- An Ascending triangle is drawn with a flat or nearly flat top and an upward-sloping bottom and is treated as an upward-breakout setup. A Descending triangle is the inverse downward-breakout hypothesis.
- The same Ascending triangle geometry can fail if price exits through the rising lower boundary after demand fades. A Descending triangle can exit lower without a surge in volume.
- Waiting for a breakout in the hypothesized direction is presented as a way to improve the win-loss record at the cost of some profit potential. Daily and weekly charts are treated as useful for identification, while monthly charts are treated as too coarse.
A pause or a last stage
A Triangle pattern can act as either a pause after a trend or the last stage of that trend before a reversal. The same structure can sit inside a continuing move or appear just as that move is ending.
The archive treats the drawn geometry as a setup for a directional hypothesis, not as a finished verdict on the next move.
How the two geometries are drawn
An Ascending triangle is drawn with a flat or nearly flat top and an upward-sloping bottom, and it is treated as an upward-breakout setup.
A Descending triangle is the inverse setup and is treated as a downward-breakout hypothesis. Both remain Triangle pattern conditions that still have to resolve.
When the same geometry fails
The same Ascending triangle geometry can fail if price exits through the rising lower boundary after demand fades. A flat or nearly flat top does not keep the upward-breakout reading intact once that lower boundary gives way.
A downside exit from a Descending triangle can occur without a surge in volume. The inverse setup is still treated as a downward-breakout hypothesis, but the archive does not require a volume surge for that lower exit.
Waiting for the hypothesized breakout
Waiting for a breakout in the hypothesized direction is presented as a way to improve the win-loss record at the cost of some profit potential. The wait is framed as a trade-off, not as a free improvement.
Daily and weekly charts are treated as useful for Triangle pattern identification, while monthly charts are treated as too coarse because the pattern is time-sensitive.
Daily prices: autumn range, February high near 38, April collapse
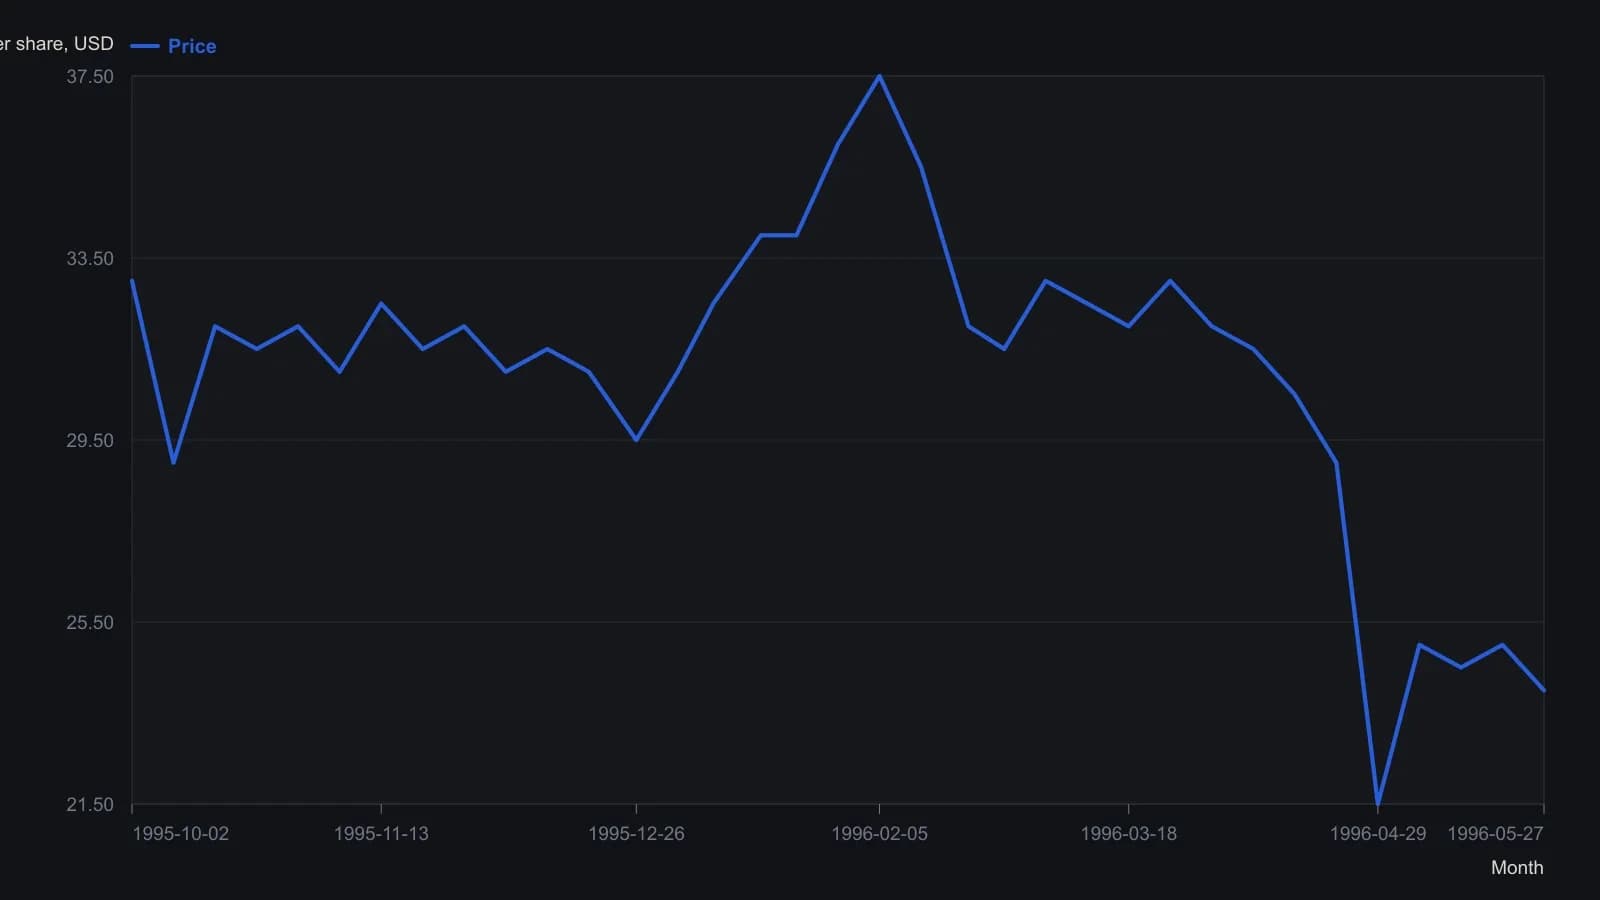
Weekly samples of the daily OHLC bars, rounded to the nearest half dollar. The magazine raster cannot support finer precision. Volume bars are visible but unlabeled, so they are omitted.