2019issue C0344-47
Rank-based sector rotation failed a late-2018 defensive-shift test
By late 2018 five open-end sector-rotation ETFs used predetermined ranking or sector-mix rules rather than a static market-cap mix. After the 2018 peak the five-name sleeves still held the same growth-heavy names and showed no cash sleeve, and none of the packaged products showed a realized benefit versus the S&P 500 comparison.
- By late 2018, five open-end sector-rotation ETFs used predetermined ranking or sector-mix rules rather than a static market-cap mix.
- After the September 2018 peak, both five-name sleeves still held the same technology, Internet, biotech, and healthcare names and showed no cash sleeve.
- Across the windows reviewed, none of the packaged rotation sleeves showed a realized benefit versus the S&P 500 comparison or a move into more defensive sectors or cash.
- Two earlier rotation products reached product-closure after failing to gather lasting assets or keep pace with the S&P 500 comparison.
How the packaged sleeves ranked names
By late 2018 the review covered five open-end sector-rotation ETFs that used predetermined ranking or sector-mix rules rather than a static market-cap mix.
One early product applied rank-rotation to First Trust sector and industry ETFs. It ranked those funds by relative strength, required volume and liquidity screens, then twice a month replaced names that fell below a rank cutoff and rebalanced to five nearly equal holdings. That concentrated-sleeve keeps only the top names and treats the ranking as a single entry-exit-or-abstain procedure.
The same design is also a momentum-rotation sleeve: it selects the strongest recent sectors or industry funds and rides that ranking until it falls, instead of holding a broad market-cap mix.
A later sibling used the same five-name ranking as an industry-rotation sleeve. It could add a one- to three-month Treasury-bill sleeve when more than one-third of the First Trust universe lost strength versus a cash index. Cash was reviewed twice monthly and limited to no more than 33 percent per review. That cash-sleeve-cap can raise Treasury-bill or cash exposure only in limited steps at each review, so a large drawdown may not produce a full defensive stance.
The defensive-shift-test after the peak
After the September 2018 peak and the subsequent drop of more than 20 percent in over half of S&P 500 stocks, both five-name sleeves still held the same technology, Internet, biotech, and healthcare names and showed no cash sleeve.
The defensive-shift-test asks whether a rotation sleeve actually reduced risk after a broad decline, rather than remaining in the same growth-heavy names.
Windows versus the buy-and-hold-baseline
Through December 26, 2018 the five rotation products posted one-year price results from -7.77 percent to -12.27 percent, while the S&P 500 ETF comparison was -3.65 percent.
Over three years the earliest five-name sleeve advanced 13.30 percent versus 34.53 percent for the S&P 500 ETF comparison, and a four-name momentum-sector sleeve advanced only 1.32 percent.
From a common start on September 26, 2017 through December 26, 2018 the S&P 500 comparison returned 2.67 percent on price while the rotation products lost between 1.2 percent and 6.26 percent and did not execute the expected defensive shift.
From a common start on March 18, 2016 through late 2018 the S&P 500 comparison beat the then-available rotation products by at least 9.5 and as much as 23.55 percentage points.
The S&P 500 ETF comparison is used here only as a buy-and-hold-baseline, a simple broad-market holding used as a historical comparison for whether the rotation overlay added or subtracted result.
Rank-rotation ETFs versus SPY, 26 Sep 2017–26 Dec 2018
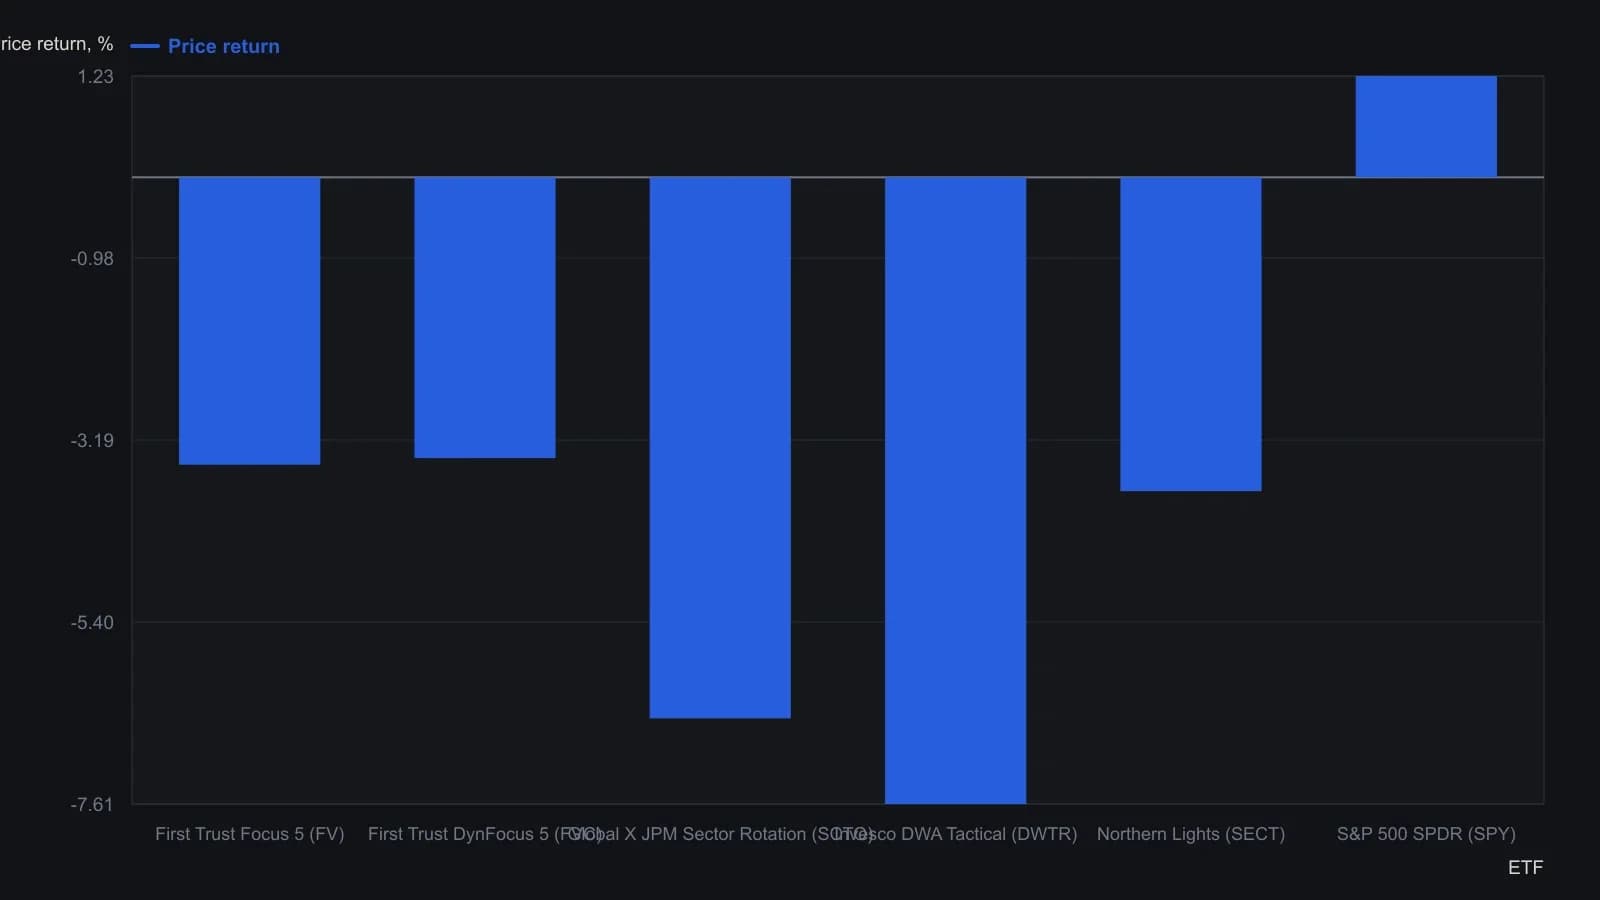
The source specifies price return, not total return, for this comparison window.
Product-closure and the review close
Two earlier rotation products were liquidated after failing to gather lasting assets or keep pace with the S&P 500 comparison. One rules-based 50-stock relative-strength sleeve lasted from January 2017 to October 2018 with about $11.6 million. Another 100-stock quantitative sleeve lasted from 2006 to 2012 and returned 10.7 percent versus 18.3 percent for the comparison. Those endings fit product-closure: when a rotation fund is liquidated after failing to gather assets or keep pace with a broad benchmark.
Across the windows reviewed, none of the packaged rotation sleeves showed a realized benefit versus the S&P 500 comparison or demonstrated that they had moved into more defensive sectors or cash during the late-2018 decline.
All readings on this track · 7 readings
- 1998Evaluating a binary relative-strength allocation
- 1999Rank-based sector-fund rotation with cash
- 2017Classroom rotation across a short factor-ETF menu
- 2017Evaluating momentum ETF rotation engines
- 2018Rotating international sleeves on relative-strength cycles
- 2019Rank-based sector rotation failed a late-2018 defensive-shift test
- 2020A five-phase compass for sector rotation and book context