2016issue C0714-17
Price action reversals at support and resistance
This archive article presents a historical price-action workflow that treats a reversal candlestick at a previously respected support or resistance area as one setup. Trend is named first, levels are marked from prior reversals, and only an exhaustive or price-rejection candle at those areas is used, with a stop a short distance beyond the level.
- Candlestick charts can describe price action on any chosen timeframe, and price after a pattern may continue or reverse.
- Exhaustive and price-rejection candlesticks are treated as more useful at previously identified support or resistance than when they appear in isolation.
- The historical procedure names the trend, marks support and resistance from prior reversals, and acts only on rejection or exhaustive candles at those levels.
- A logical bias is to look for longs in an uptrend, shorts in a downtrend, and either shorter-term swings or no trade in a sideways market.
Price action on a candlestick chart
Candlestick charts can be used to describe price action on any chosen timeframe. Price action here means a direct reading of open-high-low-close structure, without relying on calculated indicators.
Price action after a candlestick pattern may continue in the prior direction or reverse from the direction that preceded the pattern. A continuation pattern is a formation after which price is expected to keep moving in the same direction as the move that preceded it. A reversal pattern is treated as evidence that the prior direction may be changing.
Name the prevailing trend first
An uptrend is a series of higher highs and higher lows. A downtrend is a series of lower highs and lower lows. A sideways market is price movement without such a series.
A logical directional bias is to look for longs in an uptrend, shorts in a downtrend, and either shorter-term swings or no trade when the market is sideways.
Mark support and resistance from prior reversals
Support is a historically respected price area where buying has previously interrupted or reversed a decline. Resistance is a historically respected price area where selling has previously interrupted or reversed an advance. Resistance is treated as a ceiling where selling is strong enough to interrupt or reverse an uptrend.
Support and resistance areas are identified from historical price reversals at the same level. The procedure waits for price to reach those areas before a trade is initiated.
Act only on rejection at those levels
Exhaustive or price-rejection candlesticks are presented as more useful when they appear at previously identified support or resistance than when they appear in isolation. An exhaustive candlestick is read as a sign that buying or selling pressure at a level has been spent. A price-rejection candlestick appears when price tests a support or resistance area and then fails to hold beyond it.
Named reversal candlesticks catalogued as top and bottom patterns include engulfing, harami, harami cross, doji-star, hammer-family, kicker, piercing or dark-cloud, and tweezer formations. A bearish engulfing is a two-candle bearish reversal in which a later down candle covers the prior up candle. A harami cross is a reversal formation in which a small doji sits inside the prior candle's range.
USDCHF four-hour closes versus 0.9573 resistance
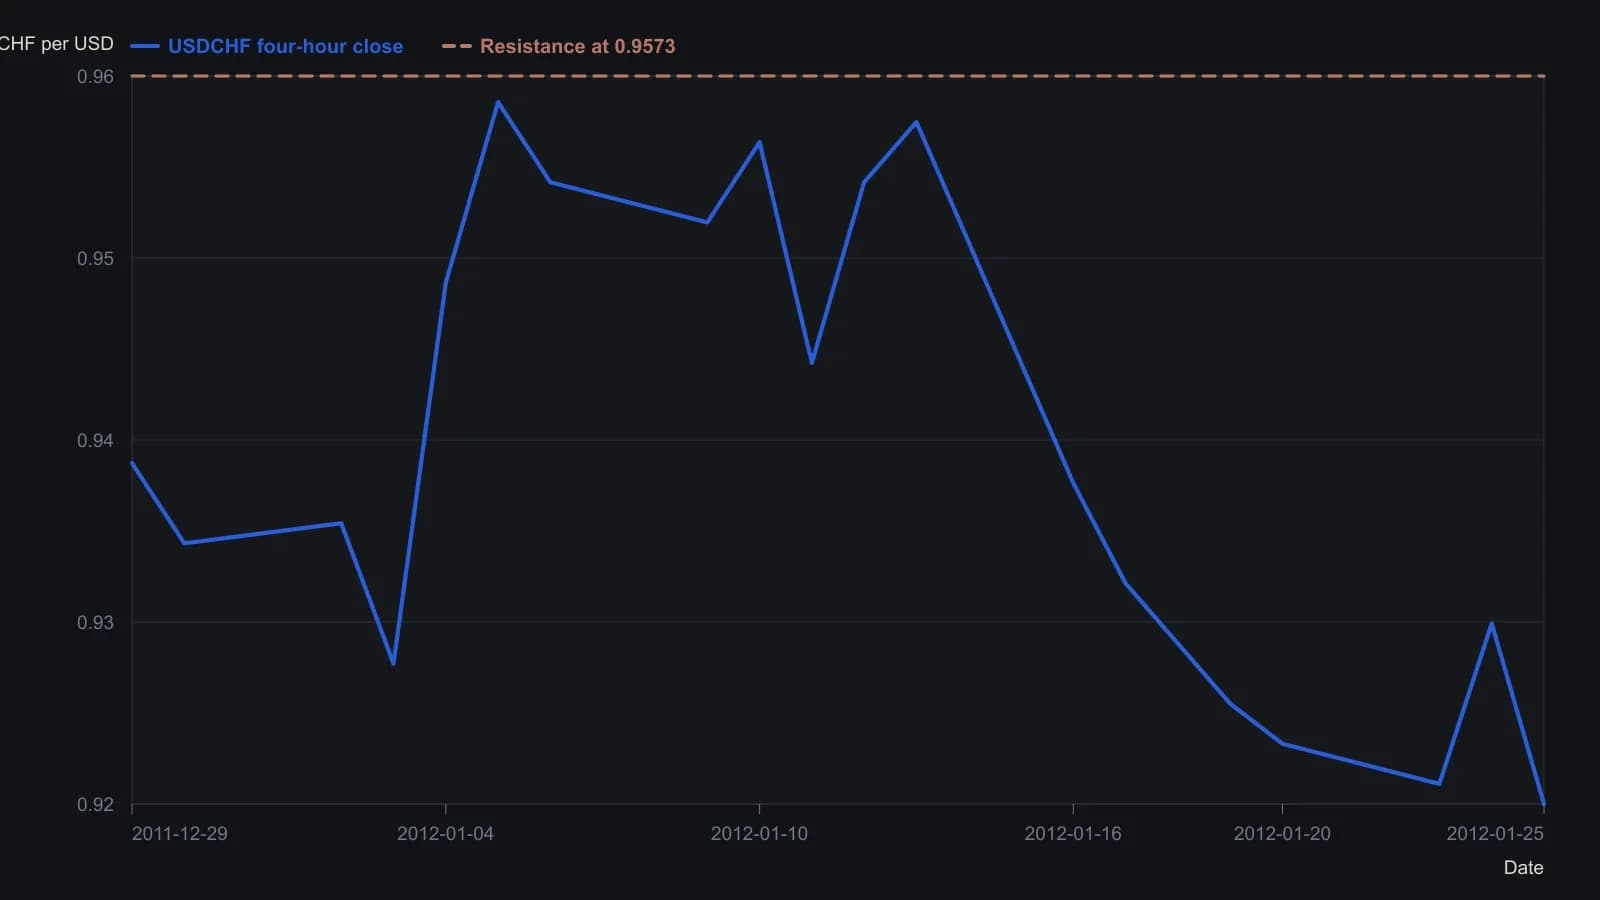
Path values are digitized from the raster and are only approximate to about ten pips; the magazine did not print an OHLC table. The 0.9573 level is the resistance stated in the text and drawn on the figure.
Three steps, then a stop
The proposed procedure combines three steps: determine the prevailing trend, mark support and resistance from prior reversals, then act only on rejection or exhaustive candles at those levels. Stop placement is a protective exit a short distance beyond the support or resistance area used for the trade. A trailing stop may be used if the move continues.
How the archive illustrated the workflow
A USDCHF four-hour example showed price failing at a horizontal resistance with a highlighted bearish engulfing pattern.
A GBPJPY example treated a harami cross at support as the signal that a downtrend had reversed enough to consider a long, with an exit planned at later rejection candles at resistance.
One procedure instead of three ideas
Editorial: the archive workflow is absent unless all three checks are present. If the market is not in a fitting trend, if price has not reached a previously respected area, or if the candle at that area is not a rejection or exhaustive candle, the combined setup is not in force and the procedure stays out.