2015issue C0718-21
A hindsight swing map as a reversal research ceiling
A confirmed high-low overlay is a laboratory ceiling, not a live cue. Count the mean-reverting swings an instrument actually printed, haircut that path for late entries and late exits, then write one reversal procedure whose entries, exits, and abstentions can be scored against that ceiling and against a single hold.
- A turning-point map marks confirmed local highs and lows only after later bars exist, so it is a hindsight overlay rather than a live entry signal.
- Mean reversion is the premise that a run to a local extreme can turn back; those repeated rises and falls are what a reversal procedure studies, and a one-way linear rise offers none.
- Before any live rule is judged, a capture haircut treats late entries and late exits as the realistic ceiling and compares the remainder with a single hold from the first marked price to the last.
- A tradability screen ranks instruments by hold result, ideal swing total, a haircut of that total, and ideal trade count, so quiet drifts are treated as hold candidates and only frequent, sizable swings as reversal candidates.
Investing, trading, and the need for swings
Investing is framed as one purchase held until a distant personal need. Trading is framed as exiting into downdrafts and buying again after price makes a new low and turns.
A one-way linear rise is described as offering no trading opportunities. Repeated rises and falls over a long span are the condition that creates them.
Mean reversion is the working premise that a run to a local extreme can turn back. That turn is what creates the repeated rises and falls a reversal procedure tries to study.
A turning-point map is not a live cue
The same swing-reversal idea can be studied on daily settlements or on weekly Friday settlements. The worked case uses a nine-year weekly series and labels a local-high-to-local-low move as a drawdown.
The turning-point map is an after-the-fact overlay of local highs and lows. Those marks can be placed only once later bars confirm the extreme. Marked turning-point prices can then be paired as an alternating short-from-high and long-from-low sequence.
Weekly GOOG turning points on the PHW overlay
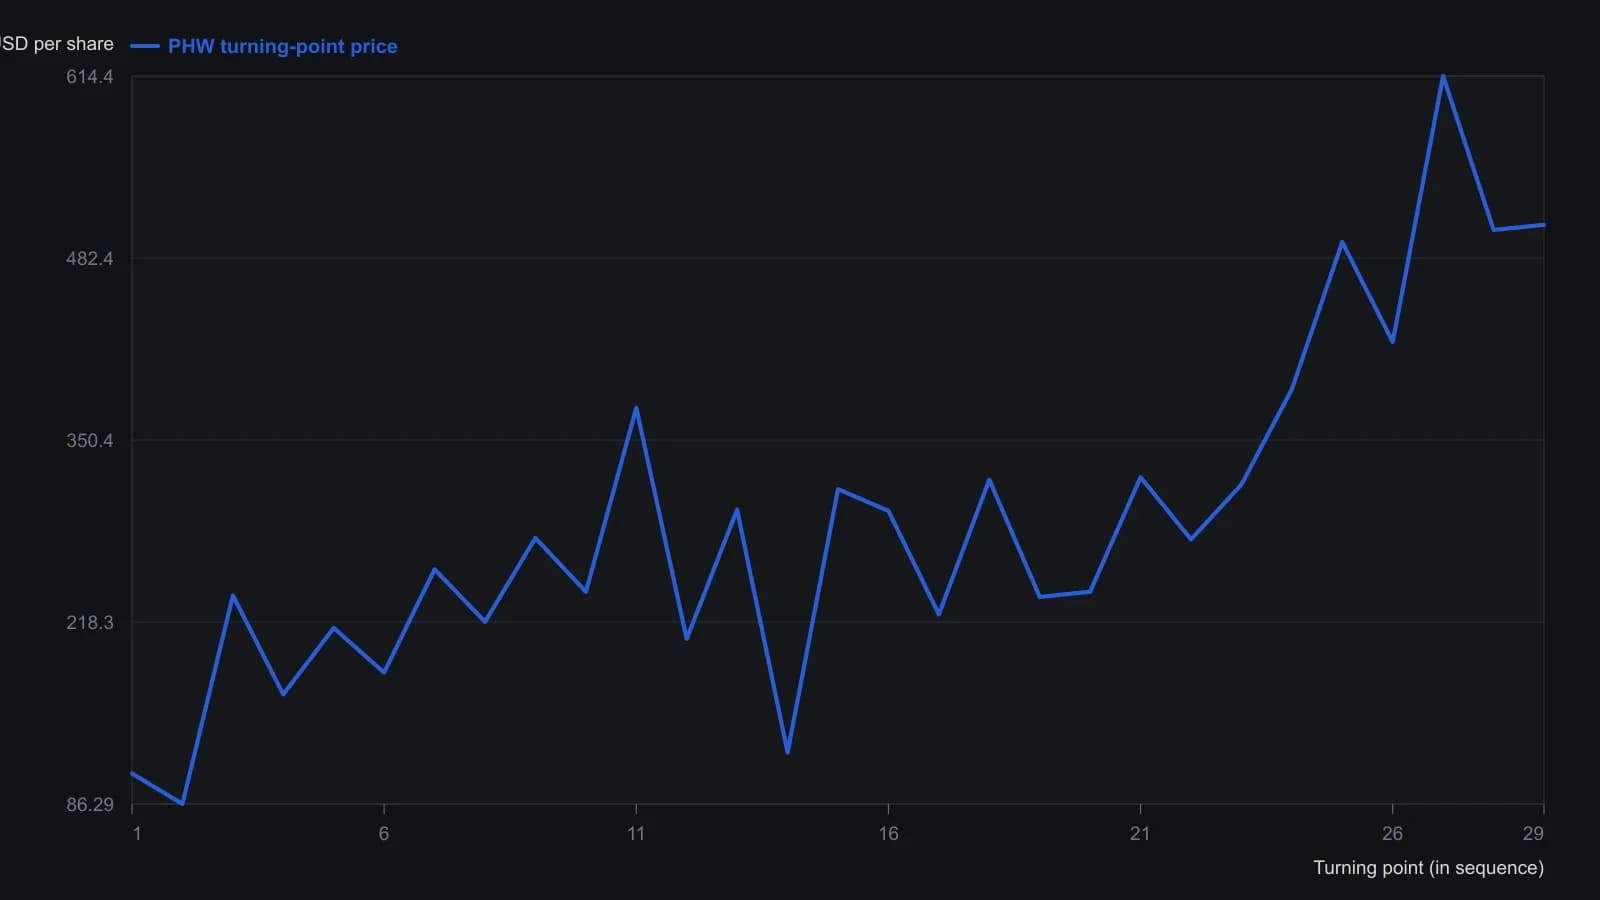
PHW places a dot only after later bars confirm the turn, so the map is a laboratory ceiling rather than a live cue. The wide chart clips the first two labels; 108.40 and 86.29 follow the zoomed panel and the typed ten-dot list. That list prints the 2006 high as 237.65; the chart label is 237.55.
One reversal procedure against a single hold
Reversal trading is a single procedure that exits and flips at a confirmed local high, then re-enters at a confirmed local low, so longs and shorts form one alternating sequence. Swing trading studies daily or weekly settlements and holds through one high-to-low or low-to-high segment at a time rather than chasing same-session churn.
A multi-trade reversal path can be compared with a single hold from the first marked price to the last. Buy and hold, in this framing, is a single purchase sized from available cash and kept until a distant personal funding goal, ignoring interim declines. The entries, exits, and abstentions of the reversal procedure are then one testable set of rules, scored against that hold.
A capture haircut before any live rule
A working research assumption is that live timing typically misses about 20 percent on the entry and 20 percent on the exit. A tester may treat about 60 percent of the ideal turning-point result as a realistic ceiling.
That capture haircut is the assumption that live timing arrives after the low and leaves after the high. It is used to lower the hindsight ceiling before any live rule is judged.
A tradability screen for quiet drifts
Instruments that mostly amble from low to high are treated as hold candidates. Instruments with more frequent, sizable swings are treated as better candidates for a reversal procedure.
A tradability screen ranks a basket by hold result, ideal swing total, a 60 percent haircut of that total, and ideal trade count. The screen is used to separate quiet drifts from markets that print many sizable reversals.
How large a swing has to be
On one high-ranked daily series the turning-point map marked 19 reversal opportunities against a single hold from the left edge to the right. A swing is treated as meaningful only when the gap between consecutive marks is more than a point or two and chart scaling has not exaggerated that gap.