2010issue C1252-62
Treat a market as a transfer device before completing a price path
A market-instrument-function construction treats price history as an input signal that a hidden device converts into a future-path output. After the function is recovered, it is applied to historical prices to draw a chart continuation. An editorial check is to reconstruct the same path with a Kalman filter and with Linear regression before relying on a completion that can stretch several years.
- A market-instrument-function construction treats price history as an input signal that a hidden device converts into a future-path output.
- The same setup is posed as three inverse problems: recover the instrument function, recover the output from a known function, or recover the input from a known function.
- Once an instrument function is obtained for a security, it is applied to historical prices to draw a continuation of the price path.
- Editorial: compare a Kalman filter reconstruction and a Linear regression reconstruction of the same path before treating a multi-year chart completion as settled.
A market as a transfer device
A market-instrument-function construction treats price history as an input signal that a hidden device converts into a future-path output. The device-plus-signals setup is written as a first-kind Fredholm integral relating input, instrument function, and output.
Three inverse problems
The construction is posed as three inverse problems. One recovers the instrument function. Another recovers the output from a known function. The third recovers the input from a known function.
From a recovered function to a path continuation
Once an instrument function is obtained for a security, it is applied to historical prices to draw a continuation of the price path. The authors state that a recovered instrument function was used to complete the last trading day on charts for a large set of listed securities. The stated prediction horizon for filling missing end-of-chart data varies from three to nine years depending on the security.
SPY actual prices and instrument-function forecast from 31 March 2008
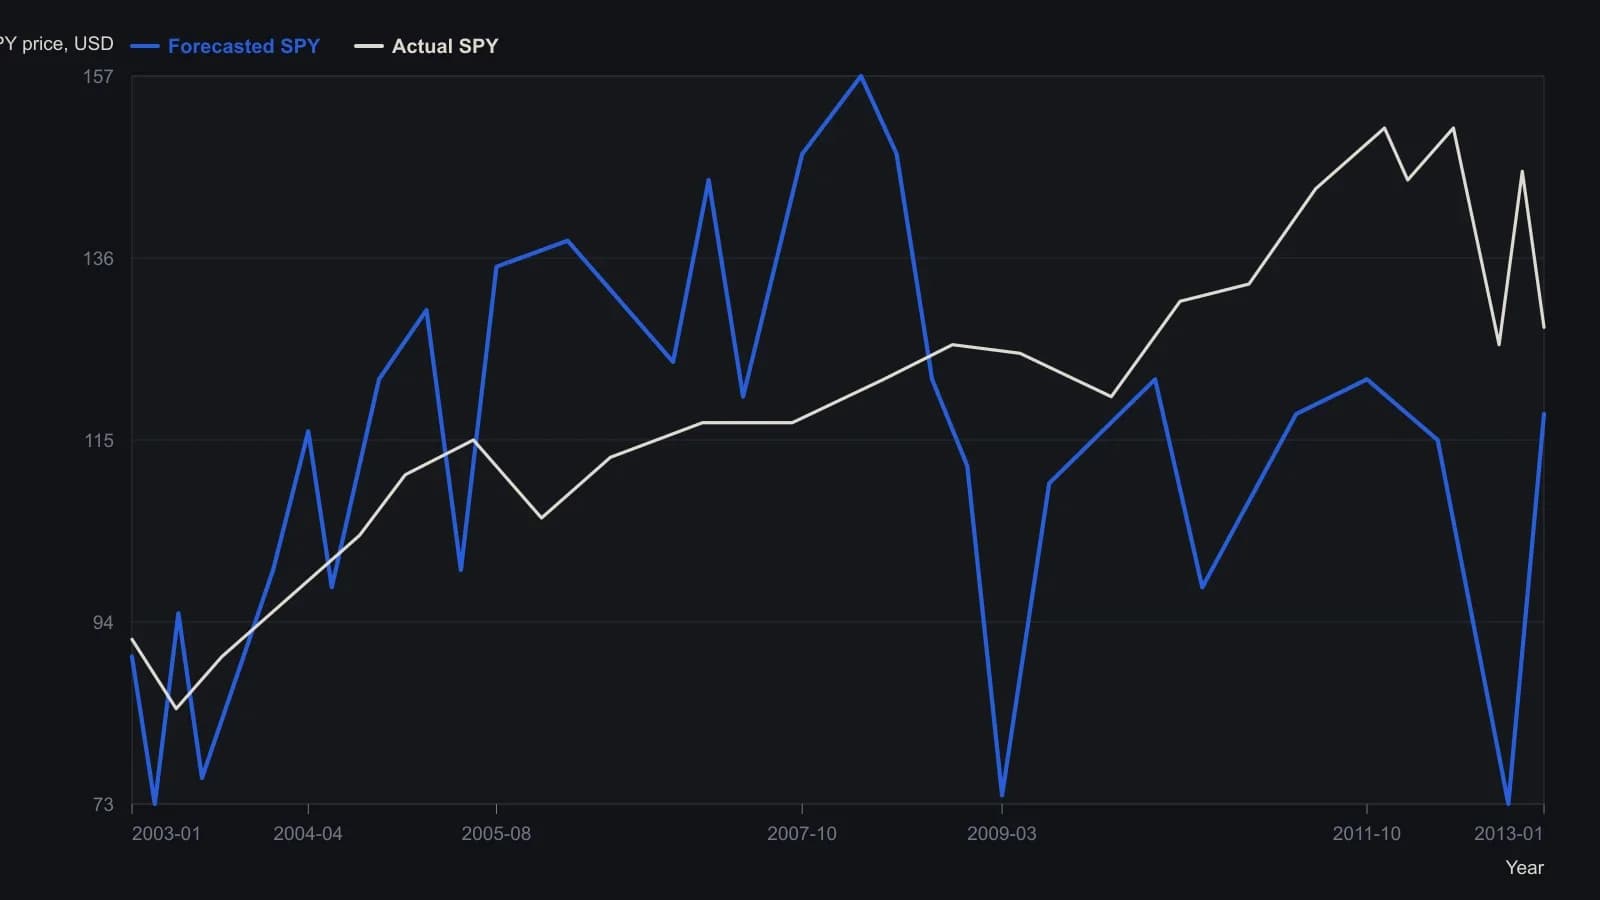
The red path is frozen at the last trading day, 31 March 2008; later prints do not revise it. The authors give the forward window as 1,245 trading days (about five years). Turning points only; the raster does not support tick-level prices.
Assumptions that keep one law in place
The model assumes a limited, stable set of collective patterns so that one mathematical law can describe later price movement. Supporting assumptions include credit, tax, seasonal, reporting, and election cycles; many indicator-based trading programs; natural cycles; and stable participant decision habits.
All readings on this track · 5 readings
- 1998T3 adaptive smoothing from regression benchmarks
- 1999Lagged trend filters for neural-network inputs
- 2006Linear forecast versus buy-and-hold when price changes cluster
- 2010Treat a market as a transfer device before completing a price path
- 2018Constructing predictive filters with RSI and walk-forward tests