2016issue C0956
Liquidity filter for executable futures orders
The archive assembles a futures liquidity score from point value, a three-year maximum price move, open interest, and a volume-adjustment-factor, then reports equal-dollar-contract-count and effective-percent-margin so listings can be compared only within each column. Editorial reading: use that liquidity-filter as an execution screen and decide eligibility before any setup is scored.
- A liquidity-filter is a pre-trade screen that ranks how easily a futures contract can be entered and exited and whether implementation cost is acceptable before a setup is treated as executable.
- Relative-contract-liquidity multiplies equal-dollar-contract-count by total open interest and a volume-adjustment-factor so markets can be ordered only against one another.
- Effective-percent-margin expresses posted margin dollars as a percent of the three-year dollar range, so capital lock-up can be compared across listings.
- Figures in each comparison column are proportional and should be read only against other contracts in the same column.
Screen execution before scoring a setup
A liquidity-filter is a pre-trade screen that ranks how easily a futures contract can be entered and exited and whether implementation cost is acceptable before a setup is treated as executable.
Activity marks on the ranking increase with trading activity. A contract with one mark or none is treated as thinly traded and harder to use for speculative execution.
How the liquidity score is assembled
A futures liquidity score can be assembled by multiplying contract point value, a three-year maximum price move, open interest, and a volume-adjustment-factor. That volume-adjustment-factor is usually an integer from 1 to 4 and rescales unusually quiet or extremely busy volume when ranking liquidity.
Equal-dollar size and effective margin
An equal-dollar column reports how many contracts of each market must be traded so that every listing is scaled to the same three-year dollar price range. Equal-dollar-contract-count is the product of the contract's dollar tick value and its three-year maximum price excursion.
Effective-percent-margin is the posted dollar margin divided by the three-year dollar range of the contract and then scaled to a percent, so margin use can be compared across listings.
Relative-contract-liquidity and column reading
The headline relative-contract-liquidity rank multiplies the equal-dollar-contract-count by total open interest and by a volume-adjustment-factor that is the greater of 1 and an exponential scaling of volume against a 5,000-contract reference. The rank is used only to order markets against one another.
Figures in each comparison column are proportional and are meant to be read only against other contracts in the same column.
Share-turnover for equities
For shares, period volume as a percentage of shares outstanding is presented as share-turnover, a turnover-rate stand-in for trading liquidity.
Effective versus listed percent margin by futures listing
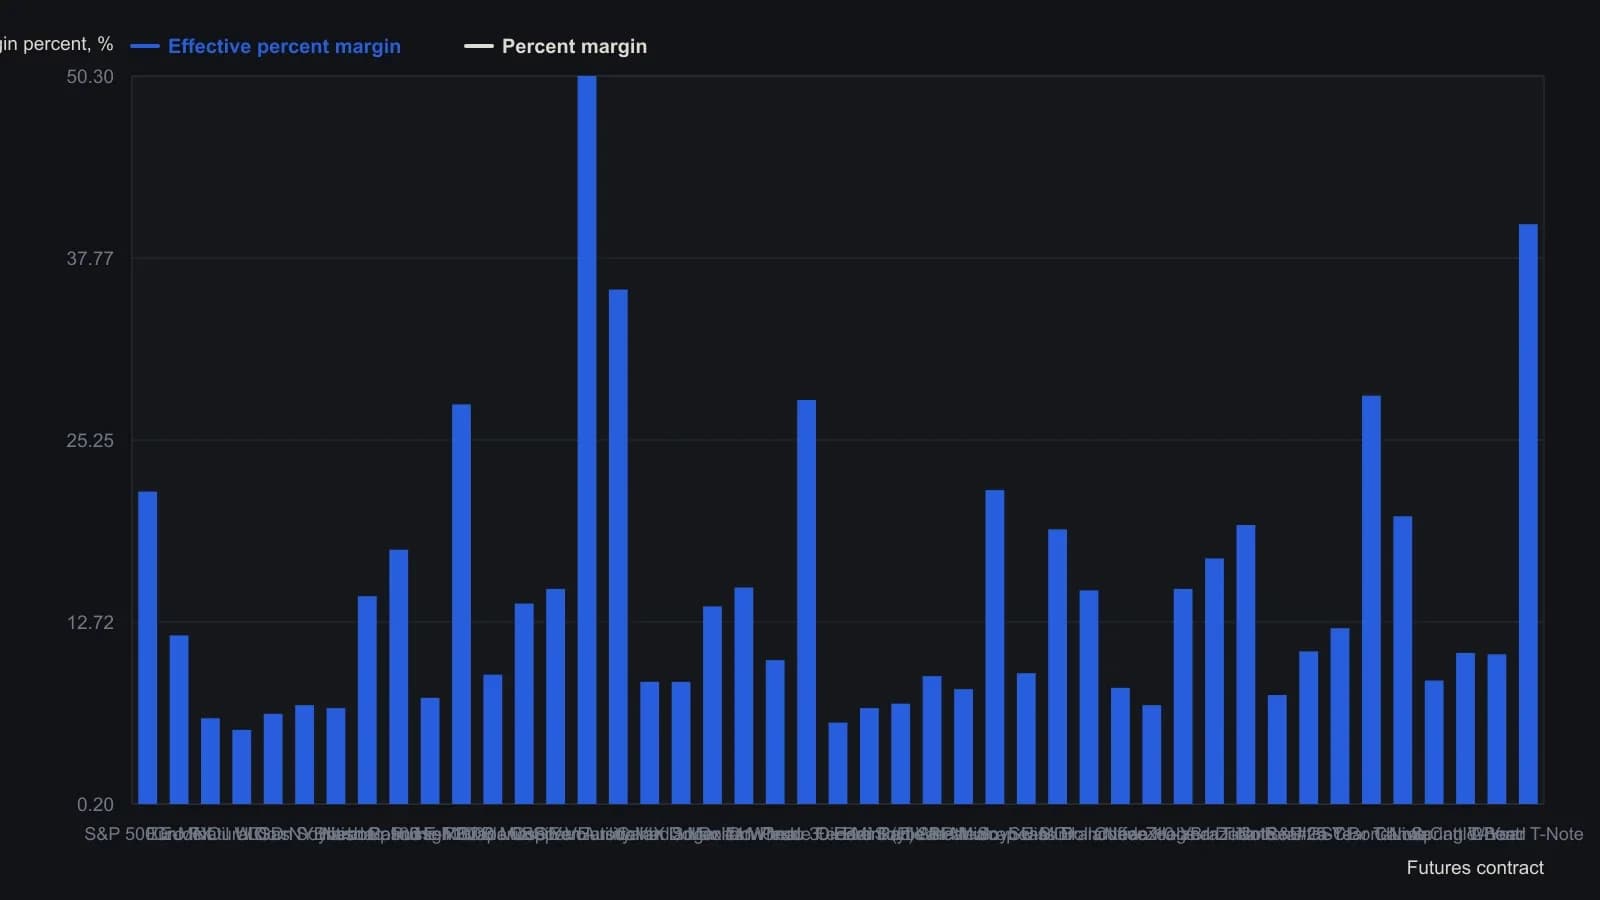
Effective percent margin is exchange margin divided by the three-year dollar range of the contract, times 100. Rows follow the source’s relative-contract-liquidity order. Relative liquidity itself is printed as dots, not a numeric series, so it is not plotted.
All readings on this track · 10 readings
- 2012Filter listed futures by relative contract liquidity
- 2013Score option liquidity before you commit the order
- 2013Evaluate futures liquidity before committing margin
- 2014A two-gate liquidity filter for listed futures
- 2015A liquidity filter to choose executable futures
- 2016Lookback and direction-test parameters for a liquidity-plus-trend screen
- 2016Same-dollar liquidity-filter for listed futures
- 2016Liquidity filter for executable futures orders
- 2017How to read a futures liquidity filter
- 2020Pre-trade liquidity filter for listed futures