2005issue C011-3
Float shifts and the limits of volume as demand
A tabulated survey of extreme float movers used year-over-year monthly volume as a stand-in for demand and treated some supply pairings as unexplained by introductory auction logic. Editorial teaching is to treat a volume-price setup as untrustworthy until available float still maps onto an executable auction.
- Tradable float is the net public share count after buybacks, option grants, and secondary issuance, not the headline shares-outstanding figure.
- Nonsplit float increasers combined a larger available supply with lower trading volume and higher prices, an outcome treated as unexplained by introductory supply-and-demand logic.
- Announced buybacks can be reduced or abandoned after the headline, and program trading can inflate reported turnover without representing discretionary single-name demand.
- Editorial sequence: run a liquidity filter first, form a volume-price hypothesis only on names that still pass a supply-demand coherence check, then keep that print inside a market-breadth overlay.
Volume is not automatically demand
Volume-price analysis is a chart-scale reading of price structure against participation, used to turn a repeatable bar condition into a falsifiable trade hypothesis from an intraday session through several weeks. Editorial reading is that this still treats reported turnover as if it were tradable demand.
The archive workflow used year-over-year monthly volume in two strong advancing months as that stand-in when it compared groups of extreme float movers. Editorial stance is that the chart condition stays untrustworthy until the name’s available float still maps onto an executable auction.
Float is the tradable share count
Float is the net shares actually available to public trading after buybacks, option grants, and secondary issuance, as distinct from shares outstanding. A liquidity filter is a pre-trade screen that uses available float, auction volume, spread, and implementation cost to decide whether an order is executable and whether reported turnover is even tradable demand.
Three float groups, one volume stand-in
A large-capitalization index survey of extreme float movers was tabulated into three groups: nonsplit increases, split-driven increases, and decreases. The tabulation did not claim statistical significance.
Year-over-year monthly volume in two strong advancing months was used as a stand-in for demand when those groups were compared.
S&P 500 extreme float movers: supply, volume, and price
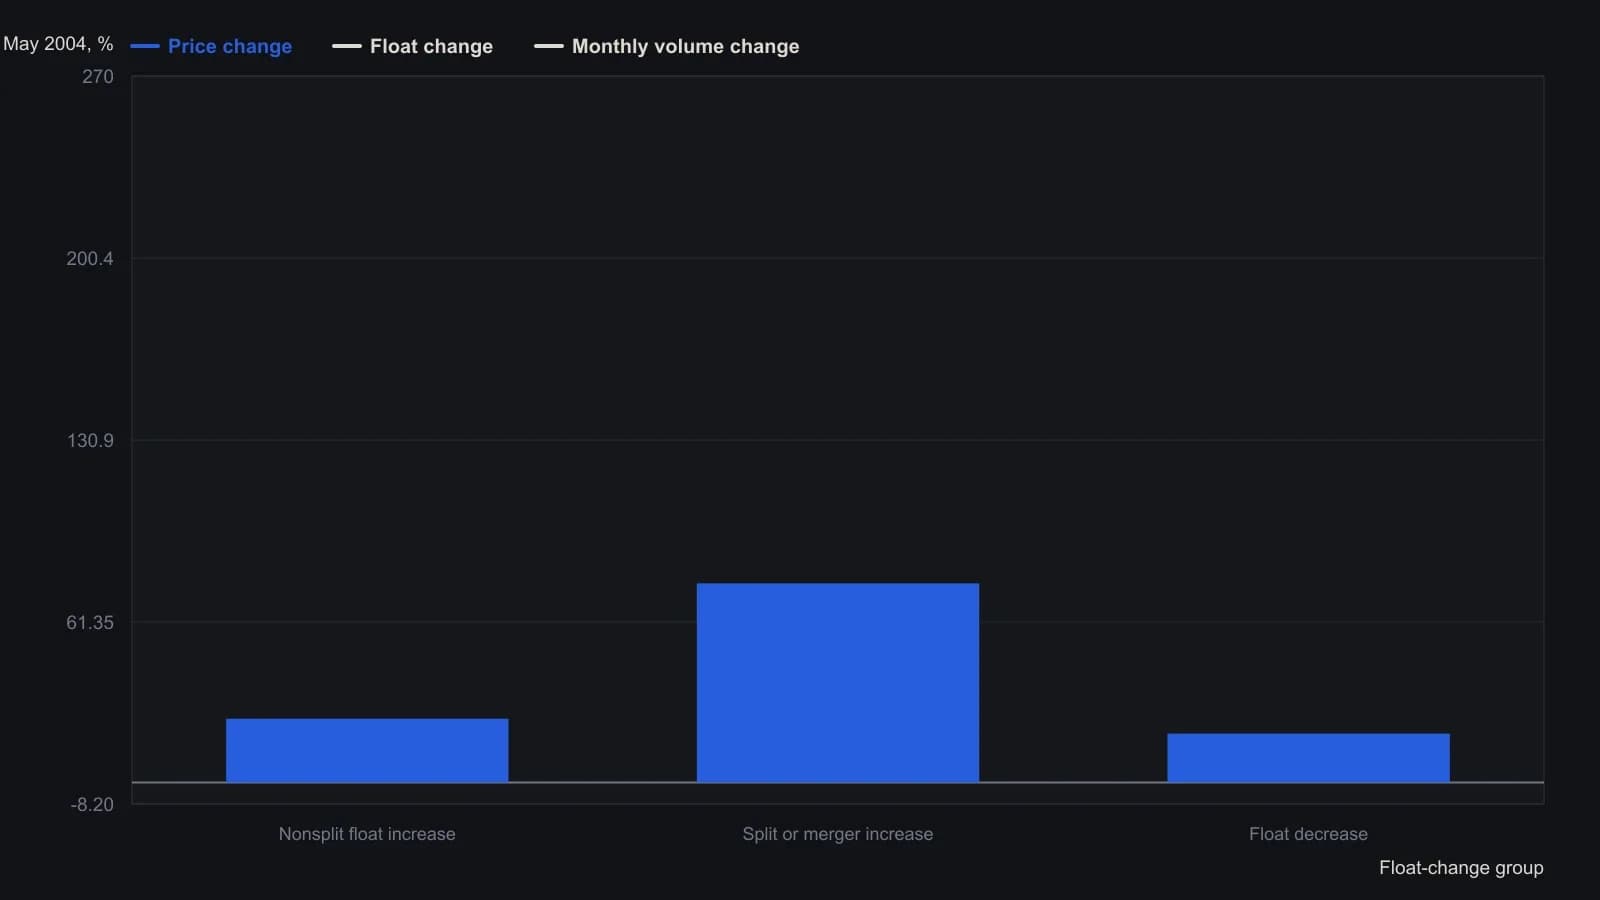
The author did not claim statistical significance. Volume is unadjusted monthly May 2003 versus May 2004 turnover and was later described as diluted by undisclosed program trading. The split-group volume average is pulled higher by IGT’s +1274% print.
Where supply and volume stop lining up
Nonsplit float increasers combined a larger available supply with lower trading volume and higher prices. The survey treated that pairing as unexplained by introductory supply-and-demand logic.
Split-driven float increases were accompanied by a larger rise in trading volume than in float. The survey treated that pairing as demand outrunning supply.
Names with a smaller float and roughly unchanged volume were described as a higher volume-to-supply ratio, meaning relatively more participation chasing fewer tradable shares.
Supply-demand coherence is a check that a completed change in available shares and a change in volume still move in a direction introductory auction logic can explain. A volume-price hypothesis is a poor candidate on names that already fail that check. The archive sequence is to isolate logically behaved names first, then apply the chart condition.
Completed supply is not a headline
A completed supply event is a share-count change that has actually settled in the tradable float, as opposed to an announced repurchase or reverse split that can be reduced or abandoned. Announced buybacks and related repurchase plans are less reliable completed supply events than stock splits, because the transactions can be reduced or abandoned after the headline.
Program trading dilutes the volume gauge
Program trading is basket or automated exchange activity that can inflate reported turnover without representing discretionary single-name demand. More than half of volume at a major U.S. listing venue was attributed to program trading. The survey argued that this makes raw volume a diluted and incomplete demand gauge when large-house program flow is not fully disclosed.
Keep one print inside a broader regime
Market-breadth context is a regime overlay that places one name’s float or volume reading inside cross-market prices, volatility, carry, and portfolio weights over weeks to months. Editorial use of that overlay is to stop one illogical print from being treated as a rule for the rest of the book.