2017issue C0458
How to read a futures liquidity filter
A TradersWeek editorial reading of a monthly futures liquidity table: first screen for contracts that can be entered and exited, then compare how many contracts and how much margin it takes to match the same dollar range.
- A futures liquidity ranking combines contract point value, a three-year maximum price range, open interest, and a volume adjustment into a descending visual score.
- Contracts shown with one or no liquidity marks are described as thinly traded and less suitable for speculative execution than contracts with many marks.
- Contracts to trade for equal dollar profit and effective percent margin compare how many contracts and how much posted capital it takes to match the same three-year dollar range.
- Each column is a proportional comparison only. A number is meaningful against other contracts in the same column, not as a standalone forecast.
Read the table as an execution filter
A liquidity filter is a pre-trade screen that uses order-book, spread, volume, auction, and cost inputs over the life of an order to decide whether a market is executable.
The archive presents a monthly futures ranking as a descending visual score. Relative contract liquidity is a ranked, visual score of how easily a listed futures contract can be bought and sold, combining size, historical price range, open interest, and a volume adjustment.
How the archive ranking is built
A futures liquidity ranking can be built by combining contract point value, a three-year maximum price range, open interest, and a volume adjustment, then displaying the result as a descending visual score.
Relative contract liquidity is defined as contracts-to-trade times total open interest times a volume factor that is the greater of 1 or a function of volume versus a 5,000-contract baseline.
Screen thinly traded contracts first
Contracts shown with one or no liquidity marks are described as thinly traded and less suitable for speculative execution than contracts with many marks.
Equalize markets by dollar range
The contracts-to-trade column equalizes markets by multiplying tick dollar value by the three-year maximum price excursion so each row represents a comparable dollar range.
Contracts to trade for equal dollar profit is the scaling factor that shows how many contracts of one futures market are needed to match the same three-year dollar range as another market.
Compare margin on the same range
Effective percent margin is margin dollars divided by the three-year contract dollar range, then multiplied by one hundred, so posted capital can be compared across futures.
Percent margin is initial margin as a percent of contract value and is useful alongside the effective-percent figure when allocating capital.
Contracts needed to match the same dollar range
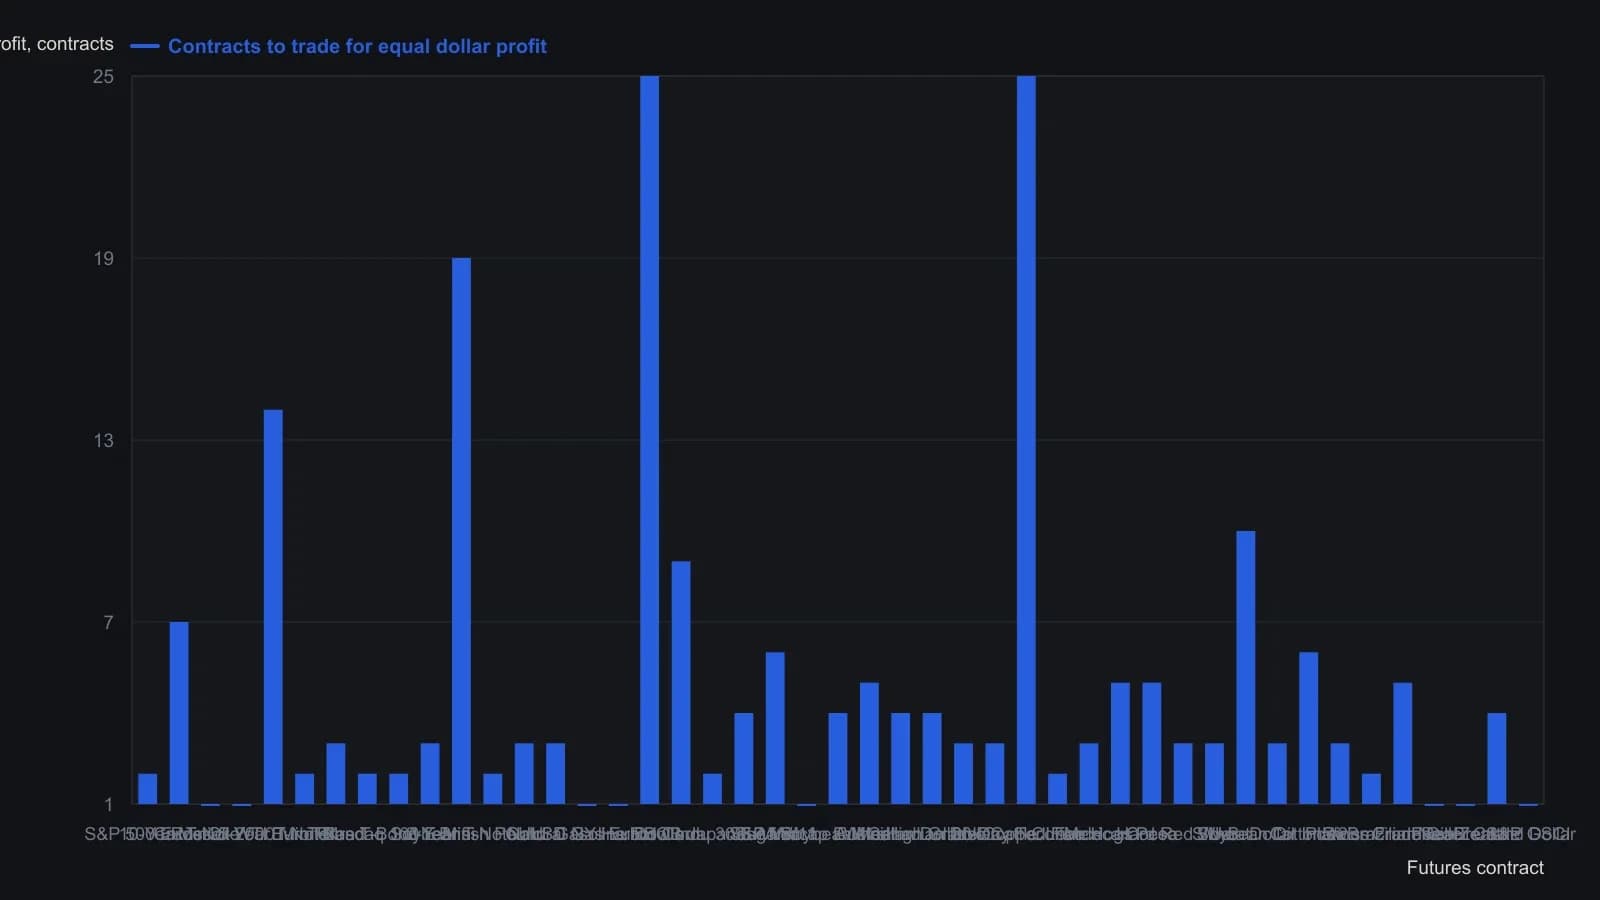
The source equalizes every listed future by multiplying contract value by the maximum price change observed over the prior three years, so each contract count represents the same dollar range.
What the April 2017 snapshot showed
In the April 2017 snapshot, equity-index and energy contracts such as the S&P 500 E-mini, 10-year T-note, and WTI crude sit at the top of the liquidity ranking, while several agricultural, metal, and FX contracts sit near the bottom.
Share turnover for listed stocks
For listed stocks, trading activity is treated as a liquidity proxy by expressing period volume as a percent of shares outstanding, also called share turnover.
All readings on this track · 10 readings
- 2012Filter listed futures by relative contract liquidity
- 2013Score option liquidity before you commit the order
- 2013Evaluate futures liquidity before committing margin
- 2014A two-gate liquidity filter for listed futures
- 2015A liquidity filter to choose executable futures
- 2016Lookback and direction-test parameters for a liquidity-plus-trend screen
- 2016Same-dollar liquidity-filter for listed futures
- 2016Liquidity filter for executable futures orders
- 2017How to read a futures liquidity filter
- 2020Pre-trade liquidity filter for listed futures