2002issue C111-5
Candlestick reliability after one-day follow-through
A historical scan of about 40 candlestick definitions on 575 U.S. stocks and bonds recorded whether the next session rose, fell, or was unchanged. The most common shapes sat near a balanced one-day split, so a pattern name was not itself a directional forecast.
- White-body candles, hammers, and black bodies already covered more than half of more than 6.14 million labeled events, so those base rates are the comparison for rarer names.
- After a white body, one-day follow-through was up 44.02 percent of the time and down 43.85 percent, close to a balanced split rather than a directional edge.
- Hammers preceded more down sessions than up sessions in the full-sample table, and dojis split almost evenly the next day.
- Inverted hammer and shooting star ranked near the top of a next-day-up list, while hammer and hanging man ranked as more often down in a declining-session table.
Labels scored by frequency and next-session outcome
The historical scan applied about 40 candlestick definitions to 575 U.S. stocks and bonds across roughly 15 to 20 years. For each labeled formation it recorded one-day follow-through: whether the next session rose, fell, or was unchanged.
Candlestick-patterns in this archive are named one-bar and multi-bar OHLC shapes scored by how often they appear and by that next-session split. The tally exceeded 6.14 million labeled formations. That total can be inflated by double-count, the practice of tallying a simple candle again when it also sits inside a larger multi-candle formation.
Common shapes set the comparison base rate
White-body candles were the most common shape, with 2,003,843 events, or 32.6 percent of the sample. Hammers were 12.6 percent and black bodies 12.1 percent. Those three labels already cover more than half of all events.
A white-body is an up-close candle and the main comparison base rate for rarer named patterns. Base rate here means the share of all labeled events that belong to a few very common shapes, against which rare pattern percentages should be read.
White body, hammer, and black body remained the three most frequent shapes across the listed international and Nasdaq samples. The archive treats that overlap as evidence that those base rates are not unique to the U.S. tape.
Next-session direction after the ten most common candlestick shapes
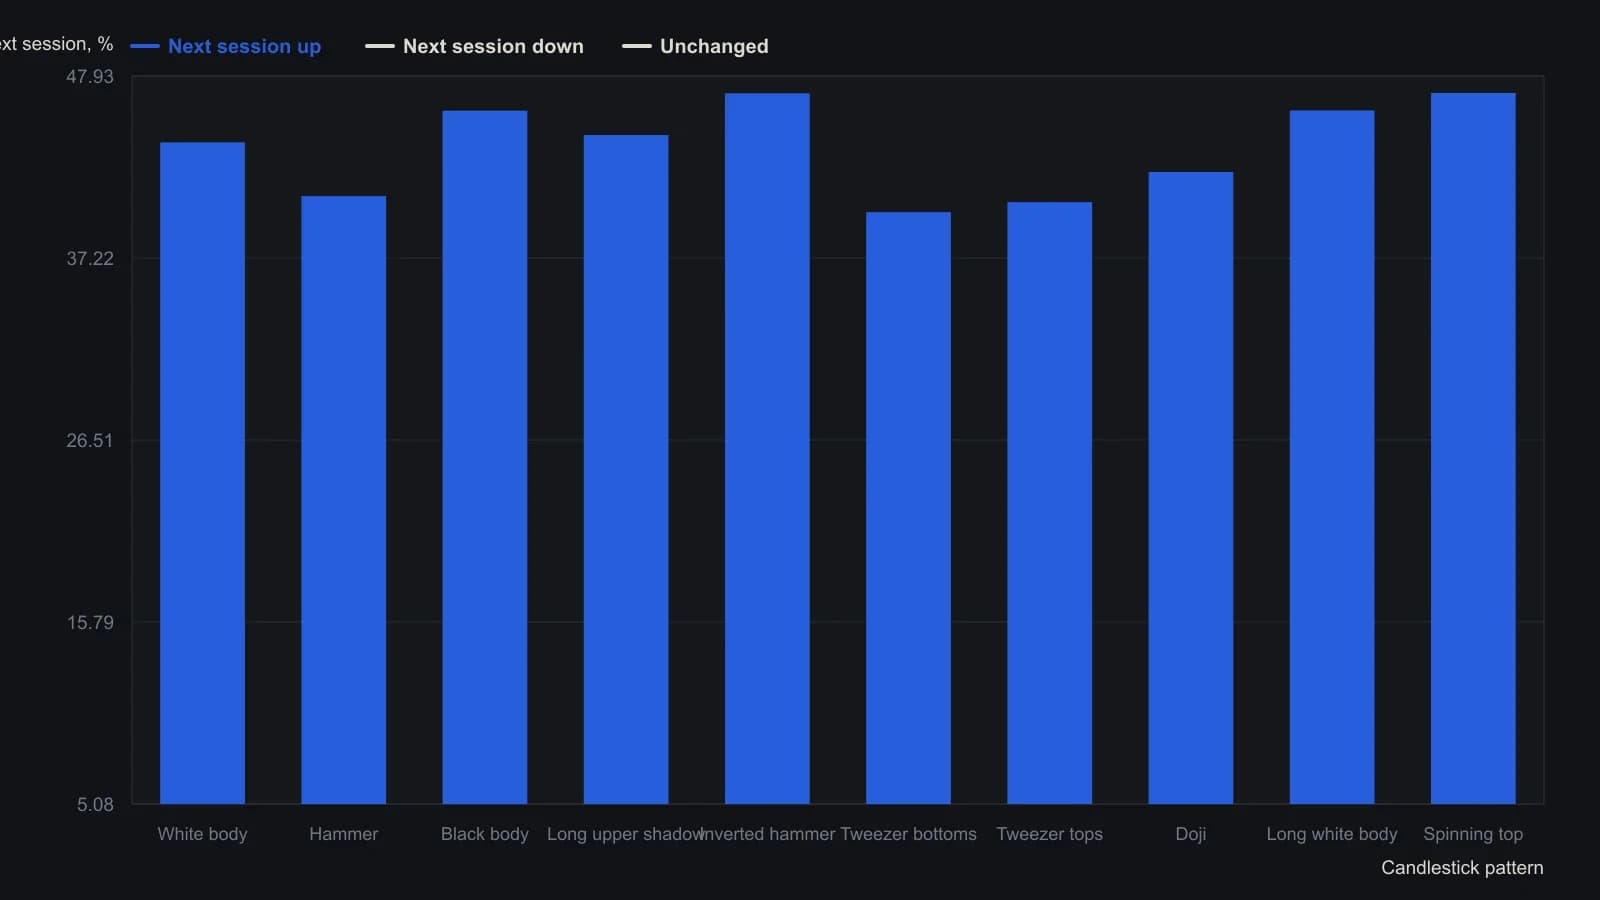
The scan used MetaStock candlestick definitions on 575 U.S. stocks and bonds over roughly 15–20 years from the early 1980s. Simple shapes were counted again when they also sat inside a larger formation, so the 6.14 million total overstates unique bars. A later reliability table lists inverted hammer only 12,616 times; the figures here are the inclusive counts from the frequency table.
One-day follow-through after white body, hammer, and doji
After a white body the next session was up 44.02 percent of the time, down 43.85 percent, and unchanged 12.12 percent. The most frequent candle is close to a balanced one-day split rather than a directional edge.
In the full-sample frequency table, hammers preceded an up session 40.86 percent of the time and a down session 45.71 percent of the time. The candlestick-hammer is a single-candle lower-shadow reversal label that is common in the sample yet does not automatically favor an up session the next day.
Dojis were 2.8 percent of the sample, or 171,945 events, and split almost evenly the next day: 42.28 percent up, 42.48 percent down, and 15.22 percent unchanged. The candlestick-doji is a near-zero-body indecision label, including dragonfly, gravestone, and long-legged variants, whose next-day split is closer to a coin flip than to a named forecast.
Rank order changes with the sort
A second reliability ranking listed inverted hammer and shooting star at 49.81 percent next-day up versus 44.84 percent down. A declining-session table listed hammer and hanging man at 43.97 percent up versus 50.71 percent down. The same family of single-candle labels can rank differently depending on the sort.
Editorial note: TradersWeek reads that rank change as a reason to check one-day follow-through against the white-body base rate, not as proof that one sort is the true ranking.
All readings on this track · 11 readings
- 1992Constructing signed engulfing and doji detectors
- 1997Candlestick breadth timing on the 1996 S&P 100
- 2002Reading doji and engulfing after extended trends
- 2002A three-lock checklist for doji, gap, and stochastic reversals
- 2002Candlestick reliability after one-day follow-through
- 2004Constructing trendline calls with doji and engulfing
- 2004Doji construction, shadow geometry, and confirmation
- 2011Candlestick signals are not automatic trades
- 2011Breakout side versus catalog labels on finished candle recipes
- 2011Grading candlestick signals by frequency, trend, and breakout
- 2015Constructing candlesticks, doji, and hammer from OHLC