1997issue C031-4
Candlestick breadth timing on the 1996 S&P 100
A historical workflow first flagged a candlestick buy or sell reversal on the S&P 100 or S&P 500, then counted matching reversals among the stocks inside that index. The larger of those two counts was used as a pace reading of how one-sided the index candle really was.
- An index reversal is only a starting flag. The next step is to count how many constituents print the same reversal versus the opposite.
- The buy-sell ratio uses the larger side of that count. Very high ratios were treated as a possible sign that a large swing was underway; small ratios as a more balanced mix of buys and sells.
- A high-volume doji after a large move, or several dojis clustered near a prior level, was treated as a consolidation or exhaustion marker.
- In the 1996 S&P 100 examples, sell-side ratios were larger than buy-side ratios. The authors read that as declines concentrated in fewer names and advances shared more broadly.
Treat the index candle as a test
An index reversal can print while the stocks that make up the index do not agree. This case study starts from that gap: the distinction between an index candle and the mix of buy versus sell candles among the stocks that make up that index.
Editorial: TradersWeek treats the next step as a breadth test. After a reversal appears on the index, count how many constituents flash the same reversal versus the opposite, then decide whether the index is being moved by many names or a few.
What the computer actually counted
Of about 1,300 candlestick patterns in the authors' library, only about 200 were treated as buy or sell reversal signals. The rest were continuation patterns. The named OHLC formations that were kept were candidate reversal signals, scanned by explicit computer rules so a buy or sell count could be tallied.
The method first scanned the S&P 500 and S&P 100 for candlestick buy or sell reversals. It then scanned the individual stocks inside the signaled index and compared the count of buys with the count of sells.
How the buy-sell ratio was reported
The reported ratio used the larger side. It was buys over sells when buys were more numerous, or sells over buys when sells were more numerous. That figure is a pace reading of how one-sided the reversal scan is among the constituents that currently match a pattern.
The authors treated very high ratios, such as over 10 to 1, as a possible sign that a large price swing was underway. Small ratios were treated as a sign that buys and sells were more balanced.
The mid-year decline on the S&P 100
On the June to December 1996 S&P 100 cash chart, a July 16 low of 582.85 and a December 3 high of 739.23 were cited. The component stocks were described as up 26.8% over those six months.
A bearish harami at the July 3, 1996 area was linked to a later decline to 582, described as 70.93 points or about 8% in little more than a month.
A scan of all 100 S&P 100 members against the 200 buy or sell patterns found 18 matches. Only one of them was a buy, producing a 17-to-1 sell-side ratio. GE and Entergy each showed two sell signals.
Doji as a consolidation or exhaustion marker
A doji is a session whose open and close are nearly identical. Here it is used as a consolidation or exhaustion marker after a large move, especially when volume is high or several dojis cluster near a prior level.
A single high-volume doji that gaps away from prior prices, or a large-volume doji after a large move, was presented as a strong candidate for a major top or bottom. Several dojis were said to cluster near correction points in a longer-term trend.
The 680 area after the decline
Support and resistance here means a prior price level that later sessions keep testing. In this case study the 680 area on the S&P 100 is the reference ceiling after the mid-year decline.
After the S&P 100 broke above the 680 resistance area it made successive record highs. The December 3, 1996 high of 739.23 was described as a 156-point, more than 28% rise from the July low.
Broader advances, narrower declines
In the examples given, sell-side constituent ratios were larger, 20 to 1 at point A and 12 to 1 at point E, than the buy-side ratios of 2 to 1, 4 to 1, and 7 to 1. The authors read that as possible evidence that declines were concentrated in fewer names while advances were broader.
S&P 100 cash, June–December 1996
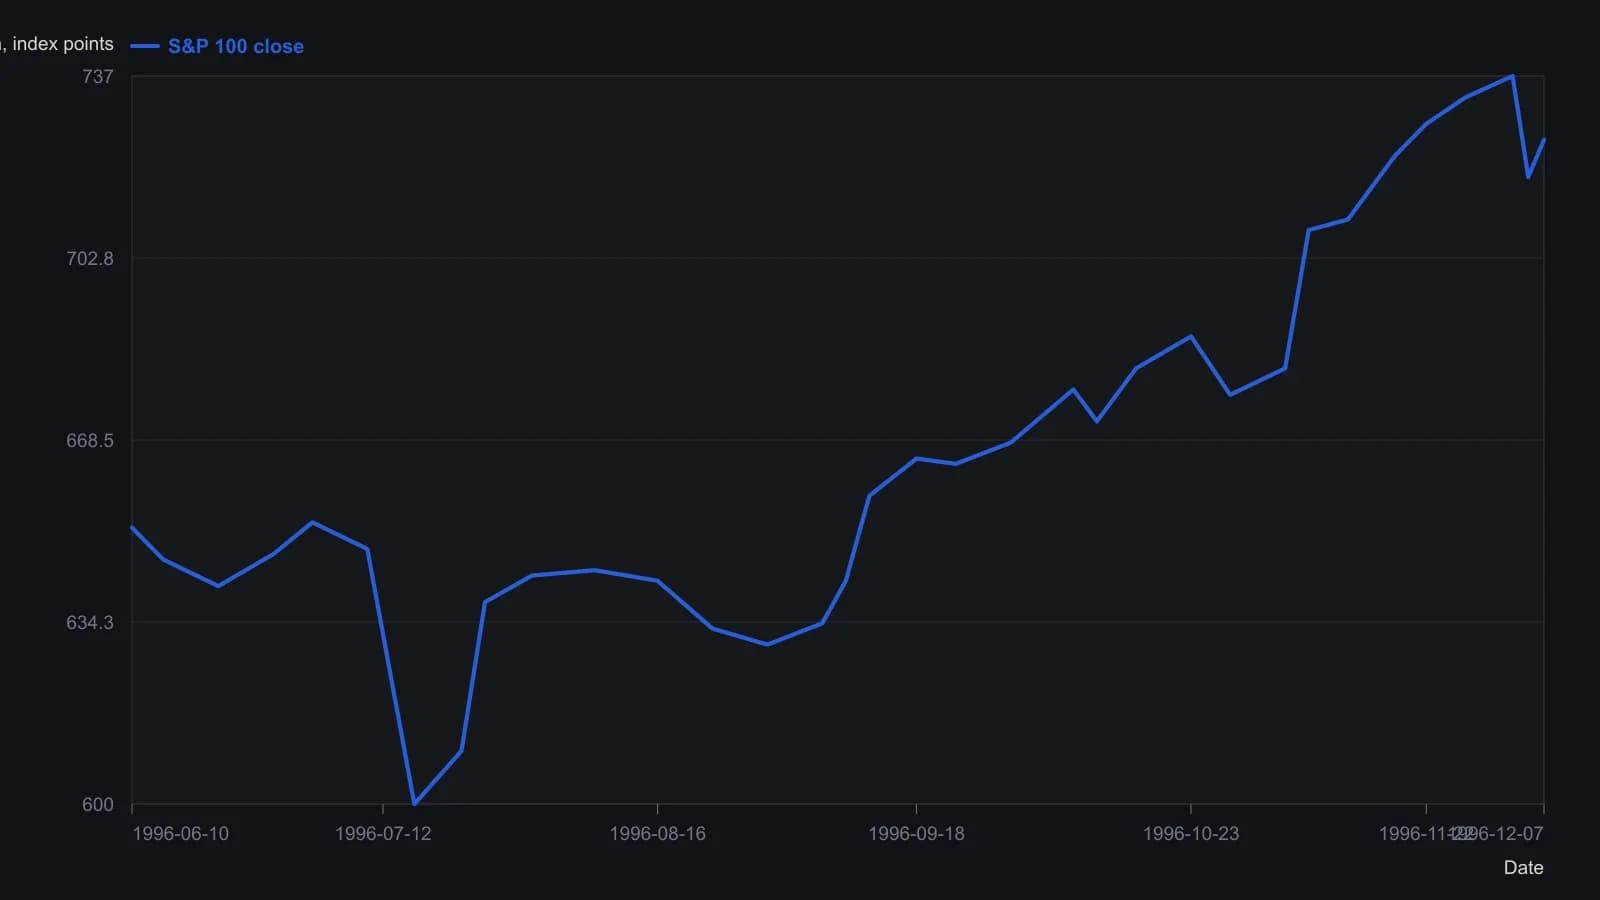
Sessions were sampled from the daily candles rather than copied bar by bar. The article cites a July 16 low of 582.85 and a December 3 high of 739.23; the magazine raster shows the July trough nearer 600, so that reading follows the printed candles.
All readings on this track · 11 readings
- 1992Constructing signed engulfing and doji detectors
- 1997Candlestick breadth timing on the 1996 S&P 100
- 2002Reading doji and engulfing after extended trends
- 2002A three-lock checklist for doji, gap, and stochastic reversals
- 2002Candlestick reliability after one-day follow-through
- 2004Constructing trendline calls with doji and engulfing
- 2004Doji construction, shadow geometry, and confirmation
- 2011Candlestick signals are not automatic trades
- 2011Breakout side versus catalog labels on finished candle recipes
- 2011Grading candlestick signals by frequency, trend, and breakout
- 2015Constructing candlesticks, doji, and hammer from OHLC